Ethiopian vs Croatian Median Earnings
COMPARE
Ethiopian
Croatian
Median Earnings
Median Earnings Comparison
Ethiopians
Croatians
$49,572
MEDIAN EARNINGS
98.8/ 100
METRIC RATING
102nd/ 347
METRIC RANK
$49,724
MEDIAN EARNINGS
99.0/ 100
METRIC RATING
94th/ 347
METRIC RANK
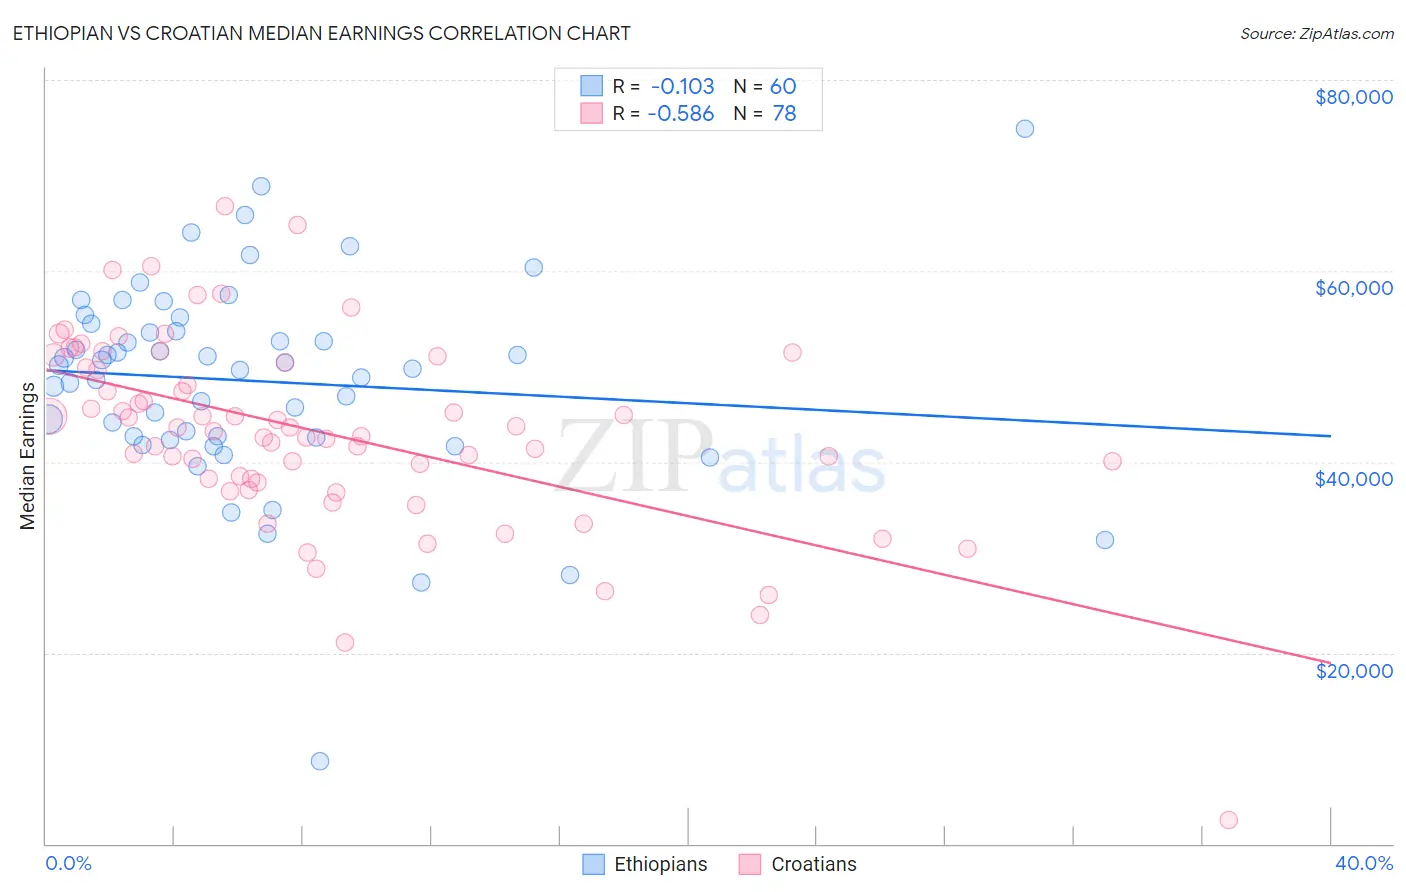
Ethiopian vs Croatian Median Earnings Correlation Chart
The statistical analysis conducted on geographies consisting of 223,260,849 people shows a poor negative correlation between the proportion of Ethiopians and median earnings in the United States with a correlation coefficient (R) of -0.103 and weighted average of $49,572. Similarly, the statistical analysis conducted on geographies consisting of 375,721,737 people shows a substantial negative correlation between the proportion of Croatians and median earnings in the United States with a correlation coefficient (R) of -0.586 and weighted average of $49,724, a difference of 0.31%.
Median Earnings Correlation Summary
| Measurement | Ethiopian | Croatian |
| Minimum | $8,623 | $2,499 |
| Maximum | $74,844 | $66,786 |
| Range | $66,221 | $64,287 |
| Mean | $48,479 | $43,106 |
| Median | $49,984 | $43,408 |
| Interquartile 25% (IQ1) | $42,620 | $38,221 |
| Interquartile 75% (IQ3) | $54,089 | $50,378 |
| Interquartile Range (IQR) | $11,470 | $12,158 |
| Standard Deviation (Sample) | $10,733 | $10,203 |
| Standard Deviation (Population) | $10,643 | $10,137 |
Demographics Similar to Ethiopians and Croatians by Median Earnings
In terms of median earnings, the demographic groups most similar to Ethiopians are Immigrants from Poland ($49,633, a difference of 0.12%), Jordanian ($49,632, a difference of 0.12%), Austrian ($49,501, a difference of 0.14%), Immigrants from Northern Africa ($49,648, a difference of 0.15%), and Immigrants from Afghanistan ($49,645, a difference of 0.15%). Similarly, the demographic groups most similar to Croatians are Immigrants from England ($49,722, a difference of 0.0%), Immigrants from Lebanon ($49,682, a difference of 0.090%), Immigrants from North Macedonia ($49,658, a difference of 0.13%), Immigrants from Northern Africa ($49,648, a difference of 0.15%), and Armenian ($49,804, a difference of 0.16%).
| Demographics | Rating | Rank | Median Earnings |
| Albanians | 99.4 /100 | #88 | Exceptional $50,116 |
| Immigrants | North America | 99.4 /100 | #89 | Exceptional $50,108 |
| Italians | 99.3 /100 | #90 | Exceptional $49,915 |
| Macedonians | 99.2 /100 | #91 | Exceptional $49,893 |
| Immigrants | Argentina | 99.2 /100 | #92 | Exceptional $49,841 |
| Armenians | 99.1 /100 | #93 | Exceptional $49,804 |
| Croatians | 99.0 /100 | #94 | Exceptional $49,724 |
| Immigrants | England | 99.0 /100 | #95 | Exceptional $49,722 |
| Immigrants | Lebanon | 99.0 /100 | #96 | Exceptional $49,682 |
| Immigrants | North Macedonia | 98.9 /100 | #97 | Exceptional $49,658 |
| Immigrants | Northern Africa | 98.9 /100 | #98 | Exceptional $49,648 |
| Immigrants | Afghanistan | 98.9 /100 | #99 | Exceptional $49,645 |
| Immigrants | Poland | 98.9 /100 | #100 | Exceptional $49,633 |
| Jordanians | 98.9 /100 | #101 | Exceptional $49,632 |
| Ethiopians | 98.8 /100 | #102 | Exceptional $49,572 |
| Austrians | 98.7 /100 | #103 | Exceptional $49,501 |
| Immigrants | Brazil | 98.6 /100 | #104 | Exceptional $49,463 |
| Immigrants | Western Asia | 98.4 /100 | #105 | Exceptional $49,389 |
| Immigrants | Albania | 98.4 /100 | #106 | Exceptional $49,377 |
| Immigrants | Morocco | 98.4 /100 | #107 | Exceptional $49,368 |
| Palestinians | 98.0 /100 | #108 | Exceptional $49,209 |