Ethiopian vs African Median Earnings
COMPARE
Ethiopian
African
Median Earnings
Median Earnings Comparison
Ethiopians
Africans
$49,572
MEDIAN EARNINGS
98.8/ 100
METRIC RATING
102nd/ 347
METRIC RANK
$41,955
MEDIAN EARNINGS
0.2/ 100
METRIC RATING
282nd/ 347
METRIC RANK
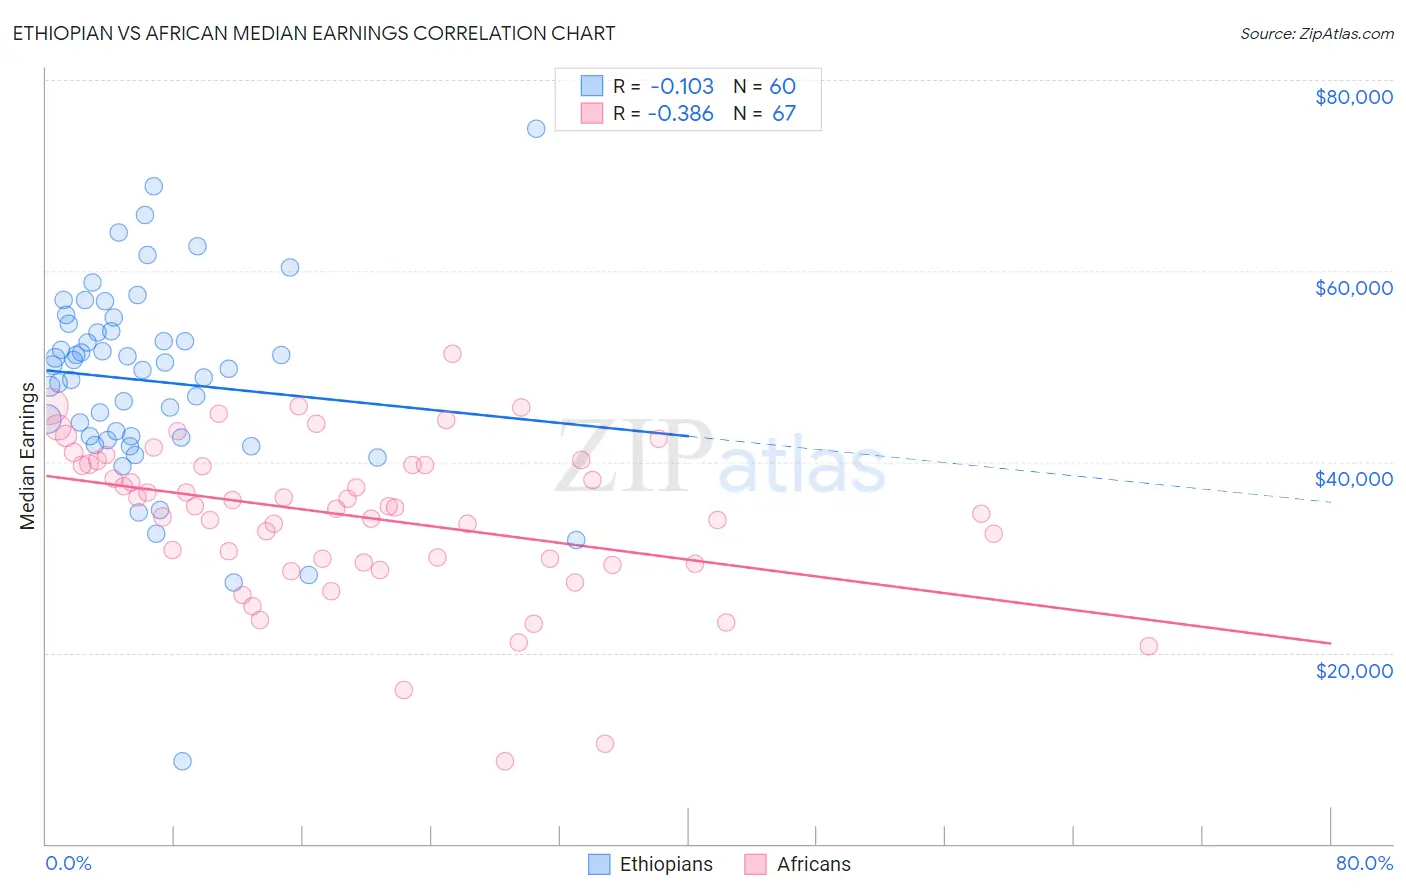
Ethiopian vs African Median Earnings Correlation Chart
The statistical analysis conducted on geographies consisting of 223,260,849 people shows a poor negative correlation between the proportion of Ethiopians and median earnings in the United States with a correlation coefficient (R) of -0.103 and weighted average of $49,572. Similarly, the statistical analysis conducted on geographies consisting of 470,066,359 people shows a mild negative correlation between the proportion of Africans and median earnings in the United States with a correlation coefficient (R) of -0.386 and weighted average of $41,955, a difference of 18.2%.
Median Earnings Correlation Summary
| Measurement | Ethiopian | African |
| Minimum | $8,623 | $8,672 |
| Maximum | $74,844 | $51,324 |
| Range | $66,221 | $42,652 |
| Mean | $48,479 | $34,249 |
| Median | $49,984 | $35,314 |
| Interquartile 25% (IQ1) | $42,620 | $29,519 |
| Interquartile 75% (IQ3) | $54,089 | $39,743 |
| Interquartile Range (IQR) | $11,470 | $10,224 |
| Standard Deviation (Sample) | $10,733 | $8,278 |
| Standard Deviation (Population) | $10,643 | $8,216 |
Similar Demographics by Median Earnings
Demographics Similar to Ethiopians by Median Earnings
In terms of median earnings, the demographic groups most similar to Ethiopians are Immigrants from Poland ($49,633, a difference of 0.12%), Jordanian ($49,632, a difference of 0.12%), Austrian ($49,501, a difference of 0.14%), Immigrants from Northern Africa ($49,648, a difference of 0.15%), and Immigrants from Afghanistan ($49,645, a difference of 0.15%).
| Demographics | Rating | Rank | Median Earnings |
| Immigrants | England | 99.0 /100 | #95 | Exceptional $49,722 |
| Immigrants | Lebanon | 99.0 /100 | #96 | Exceptional $49,682 |
| Immigrants | North Macedonia | 98.9 /100 | #97 | Exceptional $49,658 |
| Immigrants | Northern Africa | 98.9 /100 | #98 | Exceptional $49,648 |
| Immigrants | Afghanistan | 98.9 /100 | #99 | Exceptional $49,645 |
| Immigrants | Poland | 98.9 /100 | #100 | Exceptional $49,633 |
| Jordanians | 98.9 /100 | #101 | Exceptional $49,632 |
| Ethiopians | 98.8 /100 | #102 | Exceptional $49,572 |
| Austrians | 98.7 /100 | #103 | Exceptional $49,501 |
| Immigrants | Brazil | 98.6 /100 | #104 | Exceptional $49,463 |
| Immigrants | Western Asia | 98.4 /100 | #105 | Exceptional $49,389 |
| Immigrants | Albania | 98.4 /100 | #106 | Exceptional $49,377 |
| Immigrants | Morocco | 98.4 /100 | #107 | Exceptional $49,368 |
| Palestinians | 98.0 /100 | #108 | Exceptional $49,209 |
| Syrians | 97.1 /100 | #109 | Exceptional $48,934 |
Demographics Similar to Africans by Median Earnings
In terms of median earnings, the demographic groups most similar to Africans are Marshallese ($41,969, a difference of 0.030%), Dominican ($41,864, a difference of 0.22%), Blackfeet ($41,822, a difference of 0.32%), Hmong ($42,111, a difference of 0.37%), and Colville ($42,151, a difference of 0.47%).
| Demographics | Rating | Rank | Median Earnings |
| Immigrants | Belize | 0.3 /100 | #275 | Tragic $42,339 |
| Spanish Americans | 0.3 /100 | #276 | Tragic $42,316 |
| Central Americans | 0.3 /100 | #277 | Tragic $42,280 |
| Cajuns | 0.3 /100 | #278 | Tragic $42,189 |
| Colville | 0.2 /100 | #279 | Tragic $42,151 |
| Hmong | 0.2 /100 | #280 | Tragic $42,111 |
| Marshallese | 0.2 /100 | #281 | Tragic $41,969 |
| Africans | 0.2 /100 | #282 | Tragic $41,955 |
| Dominicans | 0.2 /100 | #283 | Tragic $41,864 |
| Blackfeet | 0.2 /100 | #284 | Tragic $41,822 |
| Immigrants | Nicaragua | 0.1 /100 | #285 | Tragic $41,737 |
| Mexican American Indians | 0.1 /100 | #286 | Tragic $41,719 |
| Indonesians | 0.1 /100 | #287 | Tragic $41,701 |
| Immigrants | Dominican Republic | 0.1 /100 | #288 | Tragic $41,554 |
| Comanche | 0.1 /100 | #289 | Tragic $41,519 |