Ethiopian vs Immigrants from Eastern Europe Median Family Income
COMPARE
Ethiopian
Immigrants from Eastern Europe
Median Family Income
Median Family Income Comparison
Ethiopians
Immigrants from Eastern Europe
$108,251
MEDIAN FAMILY INCOME
94.5/ 100
METRIC RATING
118th/ 347
METRIC RANK
$112,527
MEDIAN FAMILY INCOME
99.4/ 100
METRIC RATING
77th/ 347
METRIC RANK
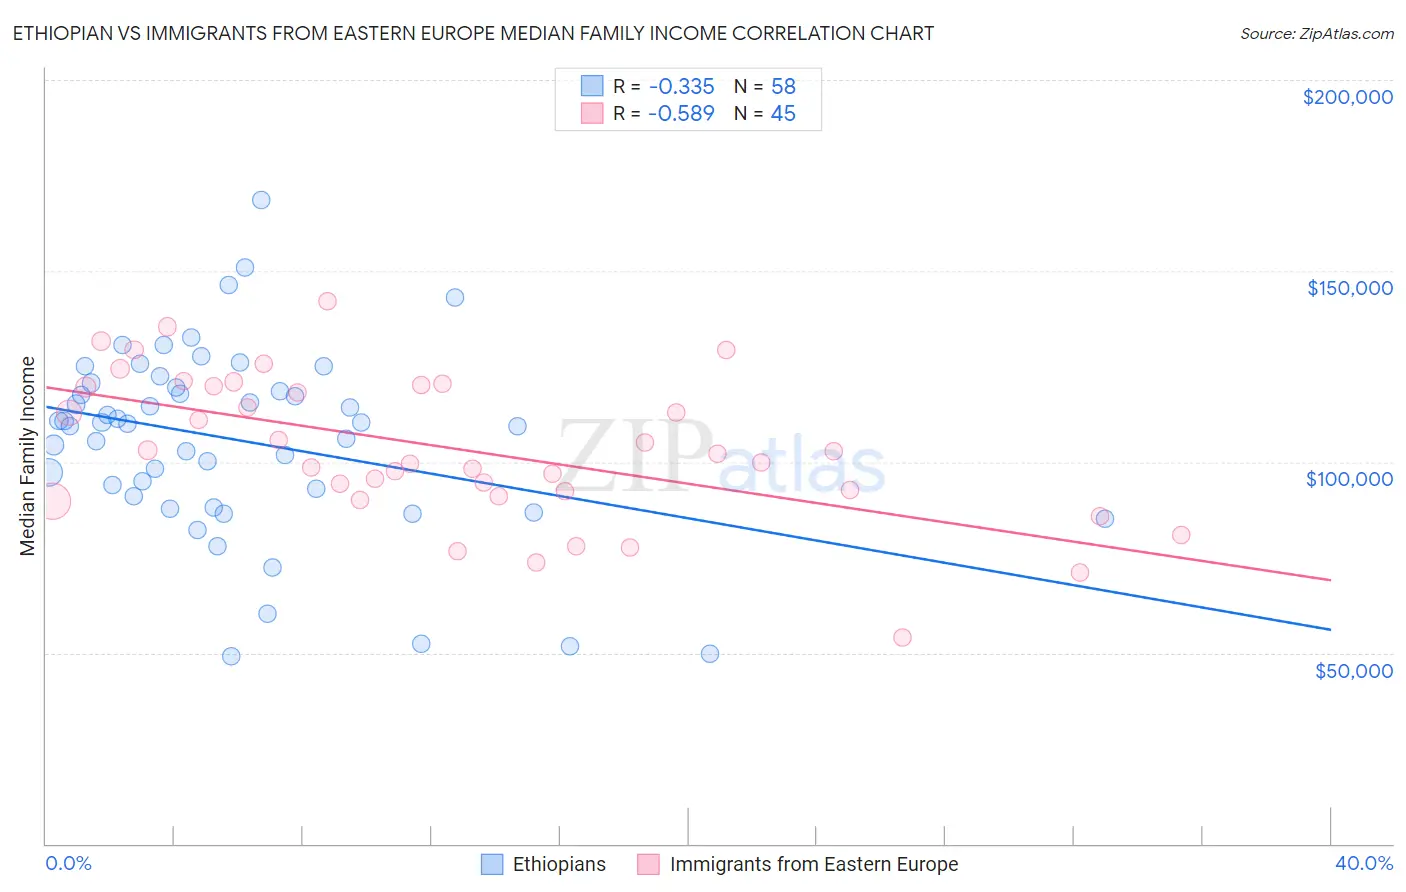
Ethiopian vs Immigrants from Eastern Europe Median Family Income Correlation Chart
The statistical analysis conducted on geographies consisting of 223,032,575 people shows a mild negative correlation between the proportion of Ethiopians and median family income in the United States with a correlation coefficient (R) of -0.335 and weighted average of $108,251. Similarly, the statistical analysis conducted on geographies consisting of 475,294,506 people shows a substantial negative correlation between the proportion of Immigrants from Eastern Europe and median family income in the United States with a correlation coefficient (R) of -0.589 and weighted average of $112,527, a difference of 4.0%.
Median Family Income Correlation Summary
| Measurement | Ethiopian | Immigrants from Eastern Europe |
| Minimum | $48,964 | $53,863 |
| Maximum | $168,594 | $142,041 |
| Range | $119,630 | $88,178 |
| Mean | $105,611 | $103,481 |
| Median | $110,185 | $102,281 |
| Interquartile 25% (IQ1) | $91,124 | $91,657 |
| Interquartile 75% (IQ3) | $119,625 | $119,896 |
| Interquartile Range (IQR) | $28,501 | $28,238 |
| Standard Deviation (Sample) | $24,590 | $19,233 |
| Standard Deviation (Population) | $24,377 | $19,018 |
Similar Demographics by Median Family Income
Demographics Similar to Ethiopians by Median Family Income
In terms of median family income, the demographic groups most similar to Ethiopians are Sri Lankan ($108,234, a difference of 0.020%), Immigrants from Philippines ($108,288, a difference of 0.030%), Immigrants from Northern Africa ($108,161, a difference of 0.080%), European ($108,099, a difference of 0.14%), and Chilean ($108,429, a difference of 0.16%).
| Demographics | Rating | Rank | Median Family Income |
| Immigrants | Western Asia | 95.6 /100 | #111 | Exceptional $108,691 |
| Immigrants | Poland | 95.3 /100 | #112 | Exceptional $108,570 |
| Immigrants | Saudi Arabia | 95.2 /100 | #113 | Exceptional $108,544 |
| Poles | 95.2 /100 | #114 | Exceptional $108,507 |
| Swedes | 95.1 /100 | #115 | Exceptional $108,499 |
| Chileans | 95.0 /100 | #116 | Exceptional $108,429 |
| Immigrants | Philippines | 94.6 /100 | #117 | Exceptional $108,288 |
| Ethiopians | 94.5 /100 | #118 | Exceptional $108,251 |
| Sri Lankans | 94.5 /100 | #119 | Exceptional $108,234 |
| Immigrants | Northern Africa | 94.3 /100 | #120 | Exceptional $108,161 |
| Europeans | 94.1 /100 | #121 | Exceptional $108,099 |
| Immigrants | Jordan | 92.9 /100 | #122 | Exceptional $107,715 |
| Carpatho Rusyns | 92.2 /100 | #123 | Exceptional $107,502 |
| Pakistanis | 91.7 /100 | #124 | Exceptional $107,390 |
| Taiwanese | 91.4 /100 | #125 | Exceptional $107,295 |
Demographics Similar to Immigrants from Eastern Europe by Median Family Income
In terms of median family income, the demographic groups most similar to Immigrants from Eastern Europe are Argentinean ($112,665, a difference of 0.12%), Immigrants from Western Europe ($112,688, a difference of 0.14%), Immigrants from Canada ($112,374, a difference of 0.14%), Italian ($112,372, a difference of 0.14%), and Immigrants from Croatia ($112,323, a difference of 0.18%).
| Demographics | Rating | Rank | Median Family Income |
| Immigrants | Romania | 99.6 /100 | #70 | Exceptional $113,434 |
| South Africans | 99.5 /100 | #71 | Exceptional $113,229 |
| Afghans | 99.5 /100 | #72 | Exceptional $112,971 |
| Laotians | 99.5 /100 | #73 | Exceptional $112,859 |
| Immigrants | Italy | 99.4 /100 | #74 | Exceptional $112,848 |
| Immigrants | Western Europe | 99.4 /100 | #75 | Exceptional $112,688 |
| Argentineans | 99.4 /100 | #76 | Exceptional $112,665 |
| Immigrants | Eastern Europe | 99.4 /100 | #77 | Exceptional $112,527 |
| Immigrants | Canada | 99.3 /100 | #78 | Exceptional $112,374 |
| Italians | 99.3 /100 | #79 | Exceptional $112,372 |
| Immigrants | Croatia | 99.3 /100 | #80 | Exceptional $112,323 |
| Immigrants | North America | 99.2 /100 | #81 | Exceptional $112,151 |
| Immigrants | England | 99.2 /100 | #82 | Exceptional $112,038 |
| Immigrants | Egypt | 99.0 /100 | #83 | Exceptional $111,689 |
| Immigrants | Hungary | 98.8 /100 | #84 | Exceptional $111,378 |