Alsatian vs Uruguayan Median Male Earnings
COMPARE
Alsatian
Uruguayan
Median Male Earnings
Median Male Earnings Comparison
Alsatians
Uruguayans
$55,380
MEDIAN MALE EARNINGS
70.5/ 100
METRIC RATING
159th/ 347
METRIC RANK
$53,680
MEDIAN MALE EARNINGS
31.1/ 100
METRIC RATING
190th/ 347
METRIC RANK
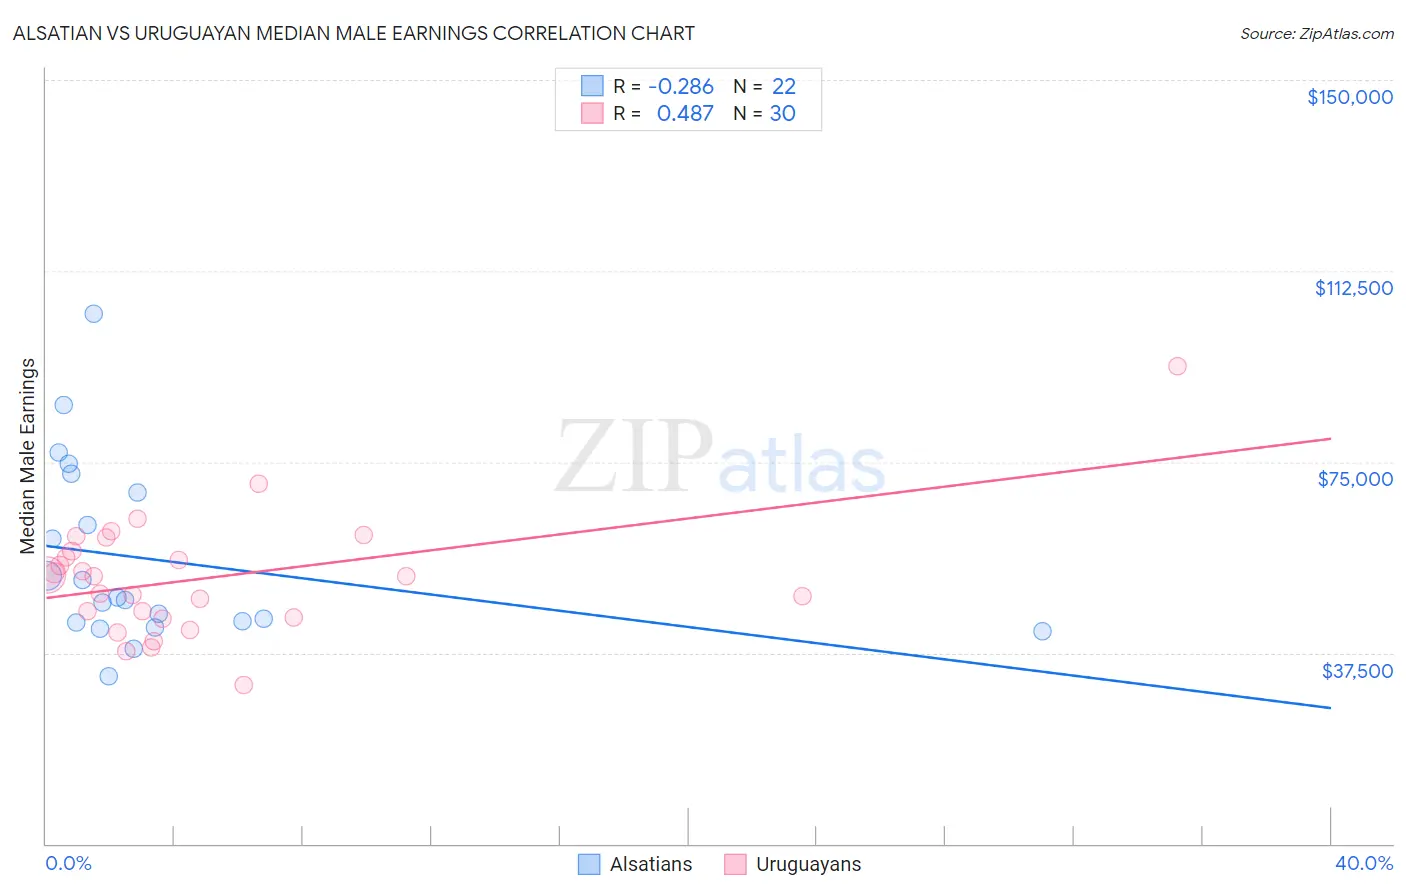
Alsatian vs Uruguayan Median Male Earnings Correlation Chart
The statistical analysis conducted on geographies consisting of 82,669,141 people shows a weak negative correlation between the proportion of Alsatians and median male earnings in the United States with a correlation coefficient (R) of -0.286 and weighted average of $55,380. Similarly, the statistical analysis conducted on geographies consisting of 144,776,277 people shows a moderate positive correlation between the proportion of Uruguayans and median male earnings in the United States with a correlation coefficient (R) of 0.487 and weighted average of $53,680, a difference of 3.2%.
Median Male Earnings Correlation Summary
| Measurement | Alsatian | Uruguayan |
| Minimum | $33,005 | $31,250 |
| Maximum | $104,004 | $93,710 |
| Range | $70,999 | $62,460 |
| Mean | $55,815 | $52,178 |
| Median | $48,104 | $52,491 |
| Interquartile 25% (IQ1) | $43,478 | $44,514 |
| Interquartile 75% (IQ3) | $69,063 | $57,550 |
| Interquartile Range (IQR) | $25,585 | $13,036 |
| Standard Deviation (Sample) | $17,889 | $11,765 |
| Standard Deviation (Population) | $17,478 | $11,568 |
Similar Demographics by Median Male Earnings
Demographics Similar to Alsatians by Median Male Earnings
In terms of median male earnings, the demographic groups most similar to Alsatians are Czechoslovakian ($55,382, a difference of 0.0%), Basque ($55,370, a difference of 0.020%), Belgian ($55,361, a difference of 0.030%), French ($55,350, a difference of 0.050%), and Icelander ($55,415, a difference of 0.060%).
| Demographics | Rating | Rank | Median Male Earnings |
| Peruvians | 75.8 /100 | #152 | Good $55,659 |
| Immigrants | Nepal | 75.0 /100 | #153 | Good $55,615 |
| Taiwanese | 73.9 /100 | #154 | Good $55,556 |
| Scandinavians | 73.4 /100 | #155 | Good $55,527 |
| Immigrants | Ethiopia | 71.6 /100 | #156 | Good $55,434 |
| Icelanders | 71.2 /100 | #157 | Good $55,415 |
| Czechoslovakians | 70.5 /100 | #158 | Good $55,382 |
| Alsatians | 70.5 /100 | #159 | Good $55,380 |
| Basques | 70.3 /100 | #160 | Good $55,370 |
| Belgians | 70.1 /100 | #161 | Good $55,361 |
| French | 69.9 /100 | #162 | Good $55,350 |
| Ugandans | 68.6 /100 | #163 | Good $55,290 |
| Immigrants | South Eastern Asia | 67.6 /100 | #164 | Good $55,241 |
| Immigrants | Portugal | 66.3 /100 | #165 | Good $55,182 |
| Germans | 61.6 /100 | #166 | Good $54,974 |
Demographics Similar to Uruguayans by Median Male Earnings
In terms of median male earnings, the demographic groups most similar to Uruguayans are Puget Sound Salish ($53,704, a difference of 0.040%), Guamanian/Chamorro ($53,661, a difference of 0.040%), Scotch-Irish ($53,658, a difference of 0.040%), Immigrants from Eritrea ($53,715, a difference of 0.060%), and Immigrants from Eastern Africa ($53,713, a difference of 0.060%).
| Demographics | Rating | Rank | Median Male Earnings |
| Immigrants | South America | 37.3 /100 | #183 | Fair $53,962 |
| Whites/Caucasians | 36.5 /100 | #184 | Fair $53,925 |
| Immigrants | Sierra Leone | 36.0 /100 | #185 | Fair $53,905 |
| Colombians | 34.4 /100 | #186 | Fair $53,832 |
| Immigrants | Eritrea | 31.8 /100 | #187 | Fair $53,715 |
| Immigrants | Eastern Africa | 31.8 /100 | #188 | Fair $53,713 |
| Puget Sound Salish | 31.6 /100 | #189 | Fair $53,704 |
| Uruguayans | 31.1 /100 | #190 | Fair $53,680 |
| Guamanians/Chamorros | 30.7 /100 | #191 | Fair $53,661 |
| Scotch-Irish | 30.6 /100 | #192 | Fair $53,658 |
| Kenyans | 30.4 /100 | #193 | Fair $53,647 |
| Spanish | 29.0 /100 | #194 | Fair $53,576 |
| Immigrants | Azores | 27.5 /100 | #195 | Fair $53,503 |
| Immigrants | Africa | 26.6 /100 | #196 | Fair $53,457 |
| Immigrants | Kenya | 26.0 /100 | #197 | Fair $53,427 |