Immigrants from Zaire vs Sri Lankan Median Male Earnings
COMPARE
Immigrants from Zaire
Sri Lankan
Median Male Earnings
Median Male Earnings Comparison
Immigrants from Zaire
Sri Lankans
$47,070
MEDIAN MALE EARNINGS
0.1/ 100
METRIC RATING
299th/ 347
METRIC RANK
$56,136
MEDIAN MALE EARNINGS
83.4/ 100
METRIC RATING
143rd/ 347
METRIC RANK
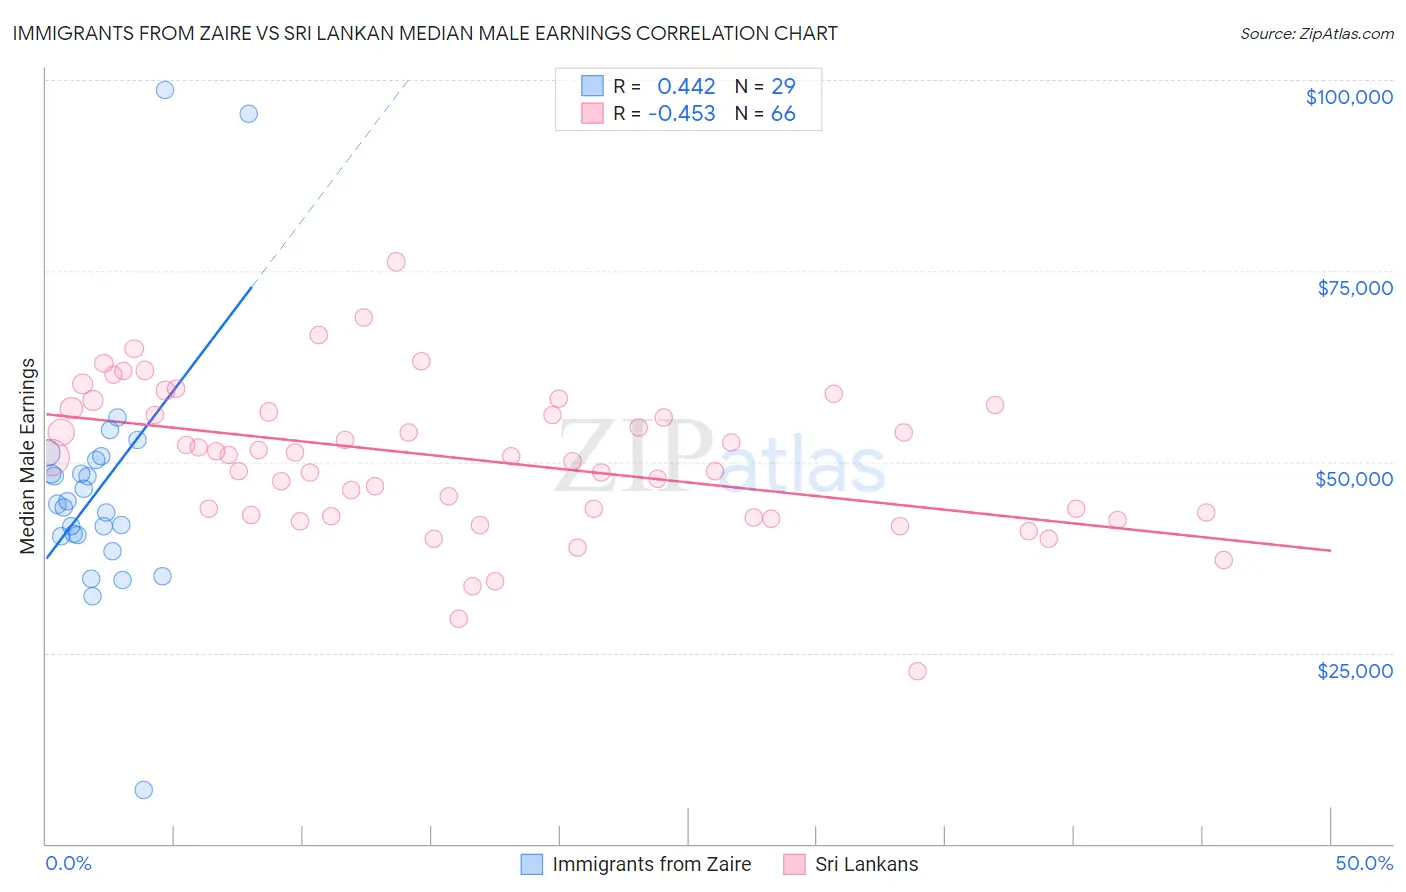
Immigrants from Zaire vs Sri Lankan Median Male Earnings Correlation Chart
The statistical analysis conducted on geographies consisting of 107,252,506 people shows a moderate positive correlation between the proportion of Immigrants from Zaire and median male earnings in the United States with a correlation coefficient (R) of 0.442 and weighted average of $47,070. Similarly, the statistical analysis conducted on geographies consisting of 440,493,989 people shows a moderate negative correlation between the proportion of Sri Lankans and median male earnings in the United States with a correlation coefficient (R) of -0.453 and weighted average of $56,136, a difference of 19.3%.
Median Male Earnings Correlation Summary
| Measurement | Immigrants from Zaire | Sri Lankan |
| Minimum | $7,065 | $22,532 |
| Maximum | $98,750 | $76,188 |
| Range | $91,685 | $53,656 |
| Mean | $46,699 | $50,350 |
| Median | $44,438 | $50,806 |
| Interquartile 25% (IQ1) | $40,386 | $43,067 |
| Interquartile 75% (IQ3) | $50,511 | $57,026 |
| Interquartile Range (IQR) | $10,125 | $13,959 |
| Standard Deviation (Sample) | $16,725 | $9,663 |
| Standard Deviation (Population) | $16,434 | $9,589 |
Similar Demographics by Median Male Earnings
Demographics Similar to Immigrants from Zaire by Median Male Earnings
In terms of median male earnings, the demographic groups most similar to Immigrants from Zaire are U.S. Virgin Islander ($47,066, a difference of 0.010%), Immigrants from Micronesia ($47,177, a difference of 0.23%), Dominican ($47,204, a difference of 0.28%), Immigrants from Latin America ($46,941, a difference of 0.28%), and Inupiat ($47,281, a difference of 0.45%).
| Demographics | Rating | Rank | Median Male Earnings |
| Immigrants | Dominica | 0.1 /100 | #292 | Tragic $47,651 |
| Indonesians | 0.1 /100 | #293 | Tragic $47,503 |
| Immigrants | Nicaragua | 0.1 /100 | #294 | Tragic $47,482 |
| Central American Indians | 0.1 /100 | #295 | Tragic $47,433 |
| Inupiat | 0.1 /100 | #296 | Tragic $47,281 |
| Dominicans | 0.1 /100 | #297 | Tragic $47,204 |
| Immigrants | Micronesia | 0.1 /100 | #298 | Tragic $47,177 |
| Immigrants | Zaire | 0.1 /100 | #299 | Tragic $47,070 |
| U.S. Virgin Islanders | 0.1 /100 | #300 | Tragic $47,066 |
| Immigrants | Latin America | 0.1 /100 | #301 | Tragic $46,941 |
| Seminole | 0.1 /100 | #302 | Tragic $46,783 |
| Yaqui | 0.1 /100 | #303 | Tragic $46,777 |
| Bangladeshis | 0.1 /100 | #304 | Tragic $46,744 |
| Guatemalans | 0.0 /100 | #305 | Tragic $46,736 |
| Dutch West Indians | 0.0 /100 | #306 | Tragic $46,656 |
Demographics Similar to Sri Lankans by Median Male Earnings
In terms of median male earnings, the demographic groups most similar to Sri Lankans are Immigrants from Uganda ($56,064, a difference of 0.13%), Danish ($56,246, a difference of 0.19%), Ethiopian ($56,243, a difference of 0.19%), Zimbabwean ($56,302, a difference of 0.29%), and Luxembourger ($56,300, a difference of 0.29%).
| Demographics | Rating | Rank | Median Male Earnings |
| Immigrants | Saudi Arabia | 87.2 /100 | #136 | Excellent $56,452 |
| Slavs | 86.5 /100 | #137 | Excellent $56,390 |
| Slovaks | 85.5 /100 | #138 | Excellent $56,306 |
| Zimbabweans | 85.5 /100 | #139 | Excellent $56,302 |
| Luxembourgers | 85.5 /100 | #140 | Excellent $56,300 |
| Danes | 84.8 /100 | #141 | Excellent $56,246 |
| Ethiopians | 84.8 /100 | #142 | Excellent $56,243 |
| Sri Lankans | 83.4 /100 | #143 | Excellent $56,136 |
| Immigrants | Uganda | 82.4 /100 | #144 | Excellent $56,064 |
| Norwegians | 80.9 /100 | #145 | Excellent $55,965 |
| Immigrants | Chile | 80.7 /100 | #146 | Excellent $55,954 |
| Immigrants | Philippines | 78.4 /100 | #147 | Good $55,809 |
| Scottish | 78.2 /100 | #148 | Good $55,793 |
| English | 77.4 /100 | #149 | Good $55,747 |
| Swiss | 77.1 /100 | #150 | Good $55,731 |