English vs Sri Lankan Unemployment Among Ages 45 to 54 years

COMPARE

English
Race
Ancestry
AfghanAfricanAlaska NativeAlaskan AthabascanAlbanianAleutAlsatianAmericanApacheArabArapahoArgentineanArmenianAssyrian/Chaldean/SyriacAustralianAustrianBahamianBangladeshiBarbadianBasqueBelgianBelizeanBermudanBhutaneseBlackfeetBolivianBrazilianBritishBritish West IndianBulgarianBurmeseCajunCambodianCanadianCape VerdeanCarpatho RusynCelticCentral AmericanCentral American IndianCherokeeCheyenneChickasawChileanChineseChippewaChoctawColombianColvilleComancheCosta RicanCreeCreekCroatianCrowCubanCypriotCzechCzechoslovakianDanishDelawareDominicanDutchDutch West IndianEastern EuropeanEcuadorianEgyptianEnglishEstonianEthiopianEuropeanFijianFilipinoFinnishFrenchFrench American IndianFrench CanadianGermanGerman RussianGhanaianGreekGuamanian/ChamorroGuatemalanGuyaneseHaitianHmongHonduranHopiHoumaHungarianIcelanderIndian (Asian)IndonesianInupiatIranianIraqiIrishIroquoisIsraeliItalianJamaicanJapaneseJordanianKenyanKiowaKoreanLaotianLatvianLebaneseLiberianLithuanianLumbeeLuxembourgerMacedonianMalaysianMalteseMarshalleseMenomineeMexicanMexican American IndianMongolianMoroccanNative HawaiianNavajoNepaleseNew ZealanderNicaraguanNigerianNorthern EuropeanNorwegianOkinawanOsageOttawaPaiutePakistaniPalestinianPanamanianParaguayanPennsylvania GermanPeruvianPimaPolishPortuguesePotawatomiPuebloPuerto RicanPuget Sound SalishRomanianRussianSalvadoranSamoanScandinavianScotch-IrishScottishSeminoleSenegaleseSerbianShoshoneSierra LeoneanSiouxSlavicSlovakSloveneSomaliSouth AfricanSouth AmericanSouth American IndianSoviet UnionSpaniardSpanishSpanish AmericanSpanish American IndianSubsaharan AfricanSudaneseSwedishSwissSyrianTaiwaneseThaiTlingit-HaidaTohono O'OdhamTonganTrinidadian and TobagonianTsimshianTurkishU.S. Virgin IslanderUgandanUkrainianUruguayanUteVenezuelanVietnameseWelshWest IndianYakamaYaquiYugoslavianYumanYup'ikZimbabwean
Immigration
NonimmigrantsImmigrantsAfghanistanAfricaAlbaniaArgentinaArmeniaAsiaAustraliaAustriaBahamasBangladeshBarbadosBelarusBelgiumBelizeBoliviaBosnia and HerzegovinaBrazilBulgariaBurma/MyanmarCabo VerdeCambodiaCameroonCanadaCaribbeanCentral AmericaChileChinaColombiaCongoCosta RicaCroatiaCubaCzechoslovakiaDenmarkDominicaDominican RepublicEastern AfricaEastern AsiaEastern EuropeEcuadorEgyptEl SalvadorEnglandEritreaEthiopiaEuropeFijiFranceGermanyGhanaGreeceGrenadaGuatemalaGuyanaHaitiHondurasHong KongHungaryIndiaIndonesiaIranIraqIrelandIsraelItalyJamaicaJapanJordanKazakhstanKenyaKoreaKuwaitLaosLatin AmericaLatviaLebanonLiberiaLithuaniaMalaysiaMexicoMicronesiaMiddle AfricaMoldovaMoroccoNepalNetherlandsNicaraguaNigeriaNorth AmericaNorth MacedoniaNorthern AfricaNorthern EuropeNorwayOceaniaPakistanPanamaPeruPhilippinesPolandPortugalRomaniaRussiaSaudi ArabiaScotlandSenegalSerbiaSierra LeoneSingaporeSomaliaSouth AfricaSouth AmericaSouth Central AsiaSouth Eastern AsiaSouthern EuropeSpainSri LankaSt. Vincent and the GrenadinesSudanSwedenSwitzerlandSyriaTaiwanThailandTrinidad and TobagoTurkeyUgandaUkraineUruguayUzbekistanVenezuelaVietnamWest IndiesWestern AfricaWestern AsiaWestern EuropeYemenZaireZimbabweAzores
Sri Lankan
Race
Ancestry
AfghanAfricanAlaska NativeAlaskan AthabascanAlbanianAleutAlsatianAmericanApacheArabArapahoArgentineanArmenianAssyrian/Chaldean/SyriacAustralianAustrianBahamianBangladeshiBarbadianBasqueBelgianBelizeanBermudanBhutaneseBlackfeetBolivianBrazilianBritishBritish West IndianBulgarianBurmeseCajunCambodianCanadianCape VerdeanCarpatho RusynCelticCentral AmericanCentral American IndianCherokeeCheyenneChickasawChileanChineseChippewaChoctawColombianColvilleComancheCosta RicanCreeCreekCroatianCrowCubanCypriotCzechCzechoslovakianDanishDelawareDominicanDutchDutch West IndianEastern EuropeanEcuadorianEgyptianEstonianEthiopianEuropeanFijianFilipinoFinnishFrenchFrench American IndianFrench CanadianGermanGerman RussianGhanaianGreekGuamanian/ChamorroGuatemalanGuyaneseHaitianHmongHonduranHopiHoumaHungarianIcelanderIndian (Asian)IndonesianInupiatIranianIraqiIrishIroquoisIsraeliItalianJamaicanJapaneseJordanianKenyanKiowaKoreanLaotianLatvianLebaneseLiberianLithuanianLumbeeLuxembourgerMacedonianMalaysianMalteseMarshalleseMenomineeMexicanMexican American IndianMongolianMoroccanNative HawaiianNavajoNepaleseNew ZealanderNicaraguanNigerianNorthern EuropeanNorwegianOkinawanOsageOttawaPaiutePakistaniPalestinianPanamanianParaguayanPennsylvania GermanPeruvianPimaPolishPortuguesePotawatomiPuebloPuerto RicanPuget Sound SalishRomanianRussianSalvadoranSamoanScandinavianScotch-IrishScottishSeminoleSenegaleseSerbianShoshoneSierra LeoneanSiouxSlavicSlovakSloveneSomaliSouth AfricanSouth AmericanSouth American IndianSoviet UnionSpaniardSpanishSpanish AmericanSpanish American IndianSri LankanSubsaharan AfricanSudaneseSwedishSwissSyrianTaiwaneseThaiTlingit-HaidaTohono O'OdhamTonganTrinidadian and TobagonianTsimshianTurkishU.S. Virgin IslanderUgandanUkrainianUruguayanUteVenezuelanVietnameseWelshWest IndianYakamaYaquiYugoslavianYumanYup'ikZimbabwean
Immigration
NonimmigrantsImmigrantsAfghanistanAfricaAlbaniaArgentinaArmeniaAsiaAustraliaAustriaBahamasBangladeshBarbadosBelarusBelgiumBelizeBoliviaBosnia and HerzegovinaBrazilBulgariaBurma/MyanmarCabo VerdeCambodiaCameroonCanadaCaribbeanCentral AmericaChileChinaColombiaCongoCosta RicaCroatiaCubaCzechoslovakiaDenmarkDominicaDominican RepublicEastern AfricaEastern AsiaEastern EuropeEcuadorEgyptEl SalvadorEnglandEritreaEthiopiaEuropeFijiFranceGermanyGhanaGreeceGrenadaGuatemalaGuyanaHaitiHondurasHong KongHungaryIndiaIndonesiaIranIraqIrelandIsraelItalyJamaicaJapanJordanKazakhstanKenyaKoreaKuwaitLaosLatin AmericaLatviaLebanonLiberiaLithuaniaMalaysiaMexicoMicronesiaMiddle AfricaMoldovaMoroccoNepalNetherlandsNicaraguaNigeriaNorth AmericaNorth MacedoniaNorthern AfricaNorthern EuropeNorwayOceaniaPakistanPanamaPeruPhilippinesPolandPortugalRomaniaRussiaSaudi ArabiaScotlandSenegalSerbiaSierra LeoneSingaporeSomaliaSouth AfricaSouth AmericaSouth Central AsiaSouth Eastern AsiaSouthern EuropeSpainSri LankaSt. Vincent and the GrenadinesSudanSwedenSwitzerlandSyriaTaiwanThailandTrinidad and TobagoTurkeyUgandaUkraineUruguayUzbekistanVenezuelaVietnamWest IndiesWestern AfricaWestern AsiaWestern EuropeYemenZaireZimbabweAzores
Unemployment Among Ages 45 to 54 years
Income
Poverty
Unemployment
Labor Participation
Family Structure
Vehicle Availability
Education Level
Disability

Unemployment Among Ages 45 to 54 years Comparison

English

Sri Lankans

Exceptional
Exceptional
4.1%
UNEMPLOYMENT AMONG AGES 45 TO 54 YEARS
100.0/ 100
METRIC RATING
20th/ 347
METRIC RANK
4.4%
UNEMPLOYMENT AMONG AGES 45 TO 54 YEARS
93.7/ 100
METRIC RATING
102nd/ 347
METRIC RANK

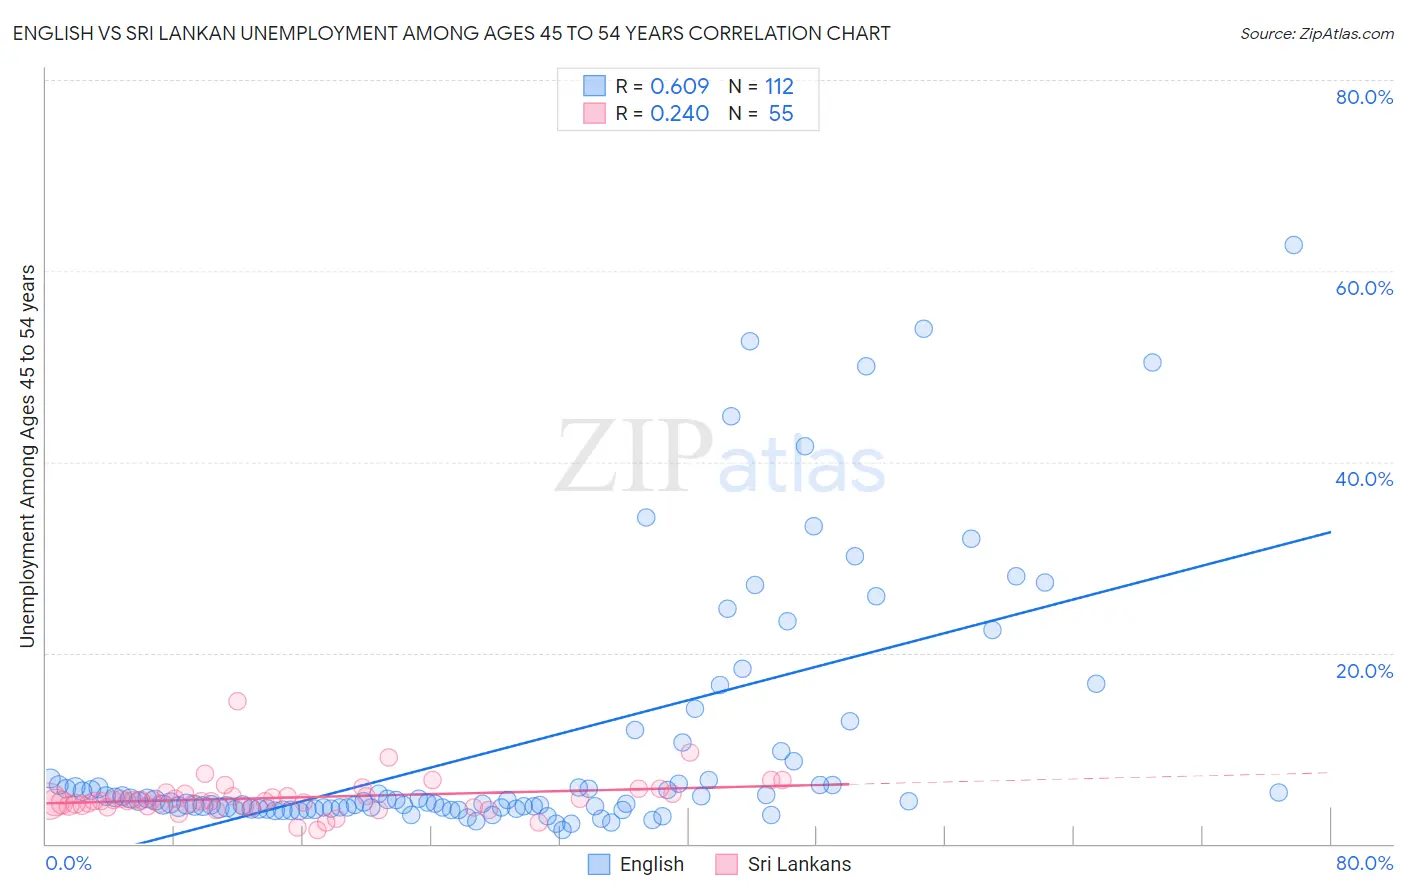
English vs Sri Lankan Unemployment Among Ages 45 to 54 years Correlation Chart

The statistical analysis conducted on geographies consisting of 532,314,880 people shows a significant positive correlation between the proportion of English and unemployment rate among population between the ages 45 and 54 in the United States with a correlation coefficient (R) of 0.609 and weighted average of 4.1%. Similarly, the statistical analysis conducted on geographies consisting of 427,577,132 people shows a weak positive correlation between the proportion of Sri Lankans and unemployment rate among population between the ages 45 and 54 in the United States with a correlation coefficient (R) of 0.240 and weighted average of 4.4%, a difference of 7.5%.
English vs Sri Lankan Unemployment Among Ages 45 to 54 years

Unemployment Among Ages 45 to 54 years Correlation Summary

MeasurementEnglishSri Lankan
Minimum1.4%1.5%
Maximum62.7%14.9%
Range61.3%13.4%
Mean10.2%4.8%
Median4.5%4.5%
Interquartile 25% (IQ1)3.7%4.0%
Interquartile 75% (IQ3)6.7%5.2%
Interquartile Range (IQR)3.0%1.2%
Standard Deviation (Sample)13.0%2.0%
Standard Deviation (Population)13.0%2.0%

Similar Demographics by Unemployment Among Ages 45 to 54 years

Demographics Similar to English by Unemployment Among Ages 45 to 54 years

In terms of unemployment among ages 45 to 54 years, the demographic groups most similar to English are Swiss (4.1%, a difference of 0.16%), European (4.1%, a difference of 0.33%), Yugoslavian (4.1%, a difference of 0.42%), Bulgarian (4.1%, a difference of 0.42%), and German (4.1%, a difference of 0.45%).
DemographicsRating | RankUnemployment Among Ages 45 to 54 years
Cubans
100.0
/100
|
#13
Exceptional
4.0%
Immigrants | Bosnia and Herzegovina
100.0
/100
|
#14
Exceptional
4.0%
Immigrants | Bolivia
100.0
/100
|
#15
Exceptional
4.0%
Thais
100.0
/100
|
#16
Exceptional
4.0%
Tongans
100.0
/100
|
#17
Exceptional
4.1%
Germans
100.0
/100
|
#18
Exceptional
4.1%
Swiss
100.0
/100
|
#19
Exceptional
4.1%
English
100.0
/100
|
#20
Exceptional
4.1%
Europeans
100.0
/100
|
#21
Exceptional
4.1%
Yugoslavians
100.0
/100
|
#22
Exceptional
4.1%
Bulgarians
100.0
/100
|
#23
Exceptional
4.1%
Carpatho Rusyns
100.0
/100
|
#24
Exceptional
4.1%
Bolivians
99.9
/100
|
#25
Exceptional
4.1%
Scottish
99.9
/100
|
#26
Exceptional
4.1%
Immigrants | Moldova
99.9
/100
|
#27
Exceptional
4.1%

Demographics Similar to Sri Lankans by Unemployment Among Ages 45 to 54 years

In terms of unemployment among ages 45 to 54 years, the demographic groups most similar to Sri Lankans are Icelander (4.4%, a difference of 0.030%), Immigrants from North America (4.4%, a difference of 0.050%), Immigrants from Sweden (4.4%, a difference of 0.13%), Immigrants from Kenya (4.4%, a difference of 0.16%), and Iranian (4.4%, a difference of 0.22%).
DemographicsRating | RankUnemployment Among Ages 45 to 54 years
Immigrants | Ethiopia
96.1
/100
|
#95
Exceptional
4.4%
Indonesians
95.4
/100
|
#96
Exceptional
4.4%
Immigrants | Canada
95.0
/100
|
#97
Exceptional
4.4%
Romanians
94.9
/100
|
#98
Exceptional
4.4%
Immigrants | Burma/Myanmar
94.9
/100
|
#99
Exceptional
4.4%
Immigrants | Eritrea
94.7
/100
|
#100
Exceptional
4.4%
Immigrants | North America
93.9
/100
|
#101
Exceptional
4.4%
Sri Lankans
93.7
/100
|
#102
Exceptional
4.4%
Icelanders
93.5
/100
|
#103
Exceptional
4.4%
Immigrants | Sweden
93.0
/100
|
#104
Exceptional
4.4%
Immigrants | Kenya
92.8
/100
|
#105
Exceptional
4.4%
Iranians
92.5
/100
|
#106
Exceptional
4.4%
Immigrants | South Africa
92.5
/100
|
#107
Exceptional
4.4%
Russians
92.1
/100
|
#108
Exceptional
4.4%
New Zealanders
91.9
/100
|
#109
Exceptional
4.4%