Immigrants from Iraq vs Yuman Median Family Income
COMPARE
Immigrants from Iraq
Yuman
Median Family Income
Median Family Income Comparison
Immigrants from Iraq
Yuman
$98,786
MEDIAN FAMILY INCOME
12.1/ 100
METRIC RATING
206th/ 347
METRIC RANK
$78,055
MEDIAN FAMILY INCOME
0.0/ 100
METRIC RATING
337th/ 347
METRIC RANK
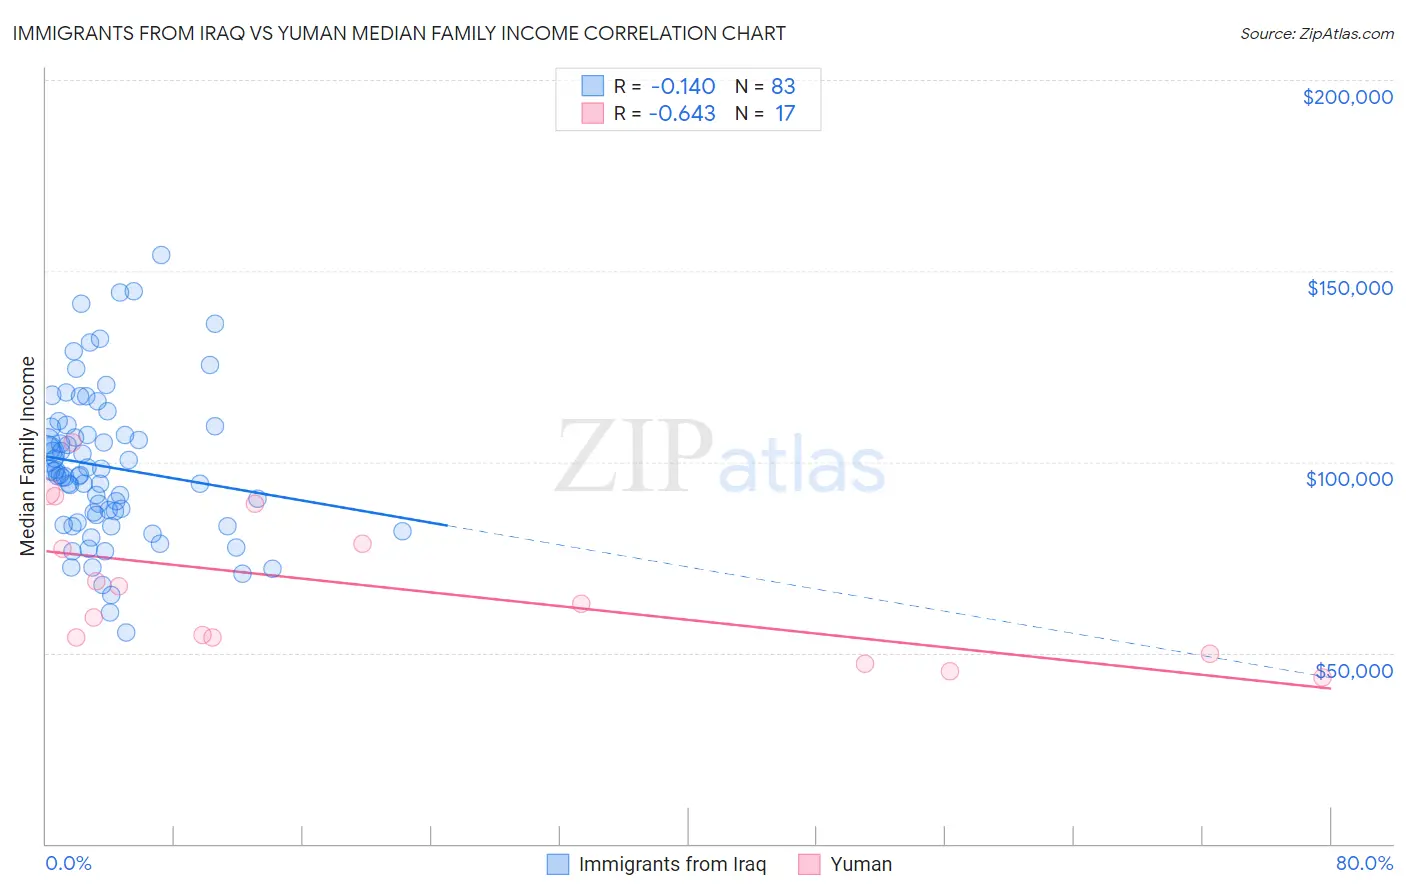
Immigrants from Iraq vs Yuman Median Family Income Correlation Chart
The statistical analysis conducted on geographies consisting of 194,718,610 people shows a poor negative correlation between the proportion of Immigrants from Iraq and median family income in the United States with a correlation coefficient (R) of -0.140 and weighted average of $98,786. Similarly, the statistical analysis conducted on geographies consisting of 40,661,885 people shows a significant negative correlation between the proportion of Yuman and median family income in the United States with a correlation coefficient (R) of -0.643 and weighted average of $78,055, a difference of 26.6%.
Median Family Income Correlation Summary
| Measurement | Immigrants from Iraq | Yuman |
| Minimum | $55,430 | $43,500 |
| Maximum | $154,107 | $104,959 |
| Range | $98,677 | $61,459 |
| Mean | $98,657 | $67,052 |
| Median | $96,637 | $62,813 |
| Interquartile 25% (IQ1) | $83,994 | $51,959 |
| Interquartile 75% (IQ3) | $108,953 | $83,716 |
| Interquartile Range (IQR) | $24,960 | $31,757 |
| Standard Deviation (Sample) | $19,813 | $18,787 |
| Standard Deviation (Population) | $19,693 | $18,226 |
Similar Demographics by Median Family Income
Demographics Similar to Immigrants from Iraq by Median Family Income
In terms of median family income, the demographic groups most similar to Immigrants from Iraq are Hawaiian ($98,869, a difference of 0.080%), Aleut ($98,702, a difference of 0.080%), Ghanaian ($98,877, a difference of 0.090%), Immigrants from Uruguay ($98,205, a difference of 0.59%), and Immigrants from Colombia ($98,067, a difference of 0.73%).
| Demographics | Rating | Rank | Median Family Income |
| Yugoslavians | 21.3 /100 | #199 | Fair $100,119 |
| Spanish | 20.1 /100 | #200 | Fair $99,977 |
| Immigrants | Thailand | 19.0 /100 | #201 | Poor $99,840 |
| Whites/Caucasians | 18.7 /100 | #202 | Poor $99,800 |
| Scotch-Irish | 17.1 /100 | #203 | Poor $99,591 |
| Ghanaians | 12.6 /100 | #204 | Poor $98,877 |
| Hawaiians | 12.5 /100 | #205 | Poor $98,869 |
| Immigrants | Iraq | 12.1 /100 | #206 | Poor $98,786 |
| Aleuts | 11.6 /100 | #207 | Poor $98,702 |
| Immigrants | Uruguay | 9.2 /100 | #208 | Tragic $98,205 |
| Immigrants | Colombia | 8.7 /100 | #209 | Tragic $98,067 |
| Puget Sound Salish | 8.2 /100 | #210 | Tragic $97,958 |
| Immigrants | Sudan | 7.4 /100 | #211 | Tragic $97,737 |
| Panamanians | 7.2 /100 | #212 | Tragic $97,683 |
| Immigrants | Armenia | 7.0 /100 | #213 | Tragic $97,605 |
Demographics Similar to Yuman by Median Family Income
In terms of median family income, the demographic groups most similar to Yuman are Immigrants from Cuba ($78,249, a difference of 0.25%), Immigrants from Yemen ($77,457, a difference of 0.77%), Pima ($77,431, a difference of 0.80%), Hopi ($77,188, a difference of 1.1%), and Pueblo ($76,880, a difference of 1.5%).
| Demographics | Rating | Rank | Median Family Income |
| Cheyenne | 0.0 /100 | #330 | Tragic $81,385 |
| Immigrants | Dominican Republic | 0.0 /100 | #331 | Tragic $81,233 |
| Natives/Alaskans | 0.0 /100 | #332 | Tragic $80,908 |
| Kiowa | 0.0 /100 | #333 | Tragic $80,885 |
| Menominee | 0.0 /100 | #334 | Tragic $79,563 |
| Yup'ik | 0.0 /100 | #335 | Tragic $79,290 |
| Immigrants | Cuba | 0.0 /100 | #336 | Tragic $78,249 |
| Yuman | 0.0 /100 | #337 | Tragic $78,055 |
| Immigrants | Yemen | 0.0 /100 | #338 | Tragic $77,457 |
| Pima | 0.0 /100 | #339 | Tragic $77,431 |
| Hopi | 0.0 /100 | #340 | Tragic $77,188 |
| Pueblo | 0.0 /100 | #341 | Tragic $76,880 |
| Crow | 0.0 /100 | #342 | Tragic $76,605 |
| Houma | 0.0 /100 | #343 | Tragic $76,188 |
| Tohono O'odham | 0.0 /100 | #344 | Tragic $72,193 |