Dominican vs Yuman Unemployment Among Seniors over 75 years
COMPARE
Dominican
Yuman
Unemployment Among Seniors over 75 years
Unemployment Among Seniors over 75 years Comparison
Dominicans
Yuman
8.7%
UNEMPLOYMENT AMONG SENIORS OVER 75 YEARS
51.9/ 100
METRIC RATING
171st/ 347
METRIC RANK
6.7%
UNEMPLOYMENT AMONG SENIORS OVER 75 YEARS
100.0/ 100
METRIC RATING
10th/ 347
METRIC RANK
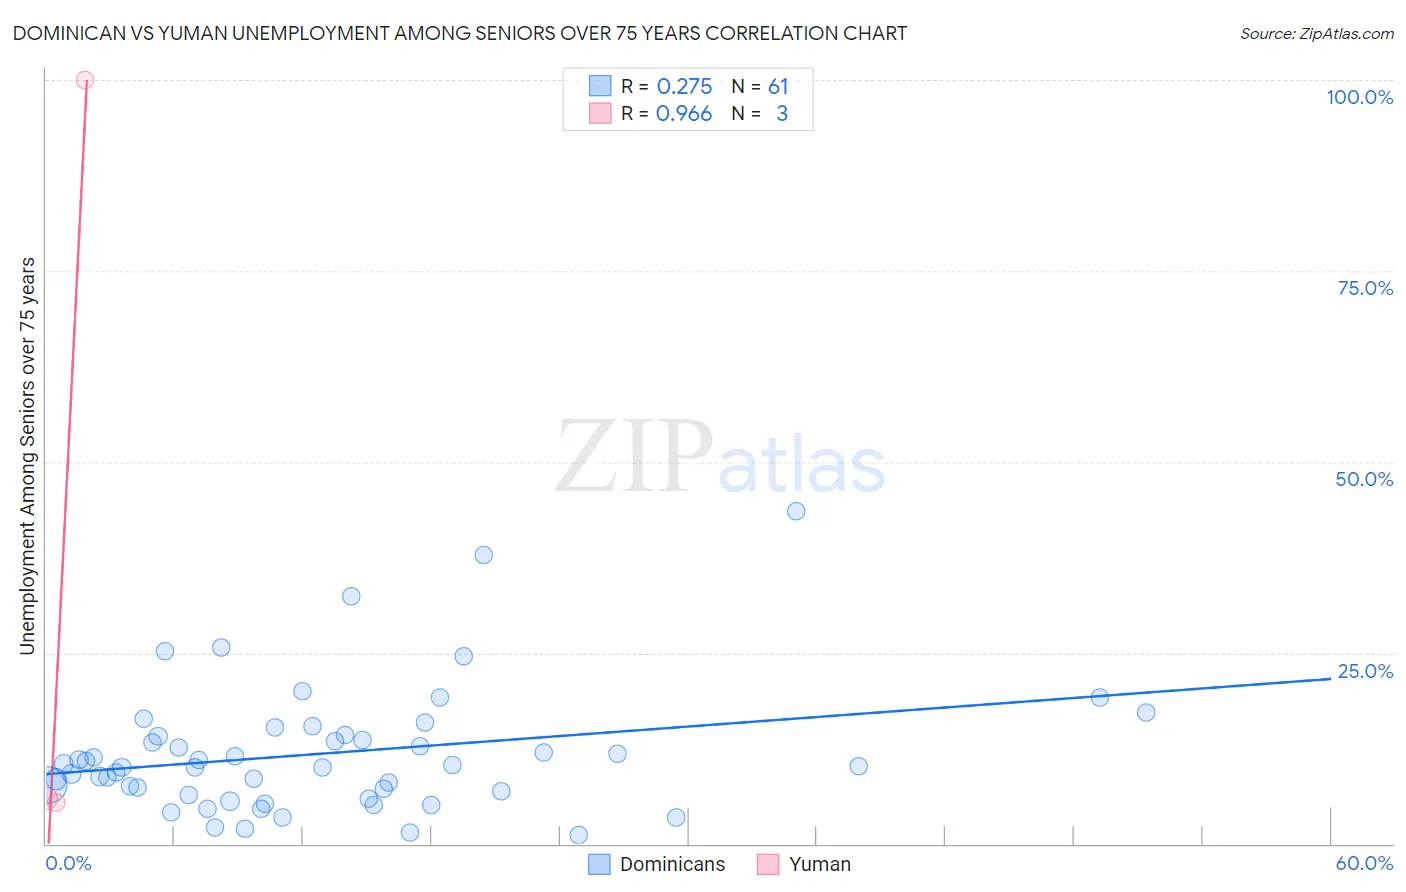
Dominican vs Yuman Unemployment Among Seniors over 75 years Correlation Chart
The statistical analysis conducted on geographies consisting of 184,970,203 people shows a weak positive correlation between the proportion of Dominicans and unemployment rate among seniors over the age of 75 in the United States with a correlation coefficient (R) of 0.275 and weighted average of 8.7%. Similarly, the statistical analysis conducted on geographies consisting of 34,222,991 people shows a perfect positive correlation between the proportion of Yuman and unemployment rate among seniors over the age of 75 in the United States with a correlation coefficient (R) of 0.966 and weighted average of 6.7%, a difference of 31.1%.
Unemployment Among Seniors over 75 years Correlation Summary
| Measurement | Dominican | Yuman |
| Minimum | 1.1% | 5.4% |
| Maximum | 43.6% | 100.0% |
| Range | 42.5% | 94.6% |
| Mean | 11.8% | 37.1% |
| Median | 10.2% | 5.9% |
| Interquartile 25% (IQ1) | 6.7% | 5.4% |
| Interquartile 75% (IQ3) | 14.2% | 100.0% |
| Interquartile Range (IQR) | 7.5% | 94.6% |
| Standard Deviation (Sample) | 8.2% | 54.5% |
| Standard Deviation (Population) | 8.2% | 44.5% |
Similar Demographics by Unemployment Among Seniors over 75 years
Demographics Similar to Dominicans by Unemployment Among Seniors over 75 years
In terms of unemployment among seniors over 75 years, the demographic groups most similar to Dominicans are Immigrants (8.7%, a difference of 0.0%), Australian (8.7%, a difference of 0.080%), Zimbabwean (8.7%, a difference of 0.12%), Immigrants from El Salvador (8.7%, a difference of 0.12%), and Syrian (8.7%, a difference of 0.12%).
| Demographics | Rating | Rank | Unemployment Among Seniors over 75 years |
| Paraguayans | 62.2 /100 | #164 | Good 8.7% |
| Immigrants | Dominican Republic | 61.4 /100 | #165 | Good 8.7% |
| Immigrants | Belize | 57.6 /100 | #166 | Average 8.7% |
| Immigrants | Eastern Africa | 57.6 /100 | #167 | Average 8.7% |
| Immigrants | Lithuania | 57.2 /100 | #168 | Average 8.7% |
| Fijians | 56.4 /100 | #169 | Average 8.7% |
| Zimbabweans | 54.1 /100 | #170 | Average 8.7% |
| Dominicans | 51.9 /100 | #171 | Average 8.7% |
| Immigrants | Immigrants | 51.8 /100 | #172 | Average 8.7% |
| Australians | 50.3 /100 | #173 | Average 8.7% |
| Immigrants | El Salvador | 49.7 /100 | #174 | Average 8.7% |
| Syrians | 49.6 /100 | #175 | Average 8.7% |
| Somalis | 45.3 /100 | #176 | Average 8.8% |
| Central Americans | 43.3 /100 | #177 | Average 8.8% |
| West Indians | 41.9 /100 | #178 | Average 8.8% |
Demographics Similar to Yuman by Unemployment Among Seniors over 75 years
In terms of unemployment among seniors over 75 years, the demographic groups most similar to Yuman are Immigrants from Grenada (6.7%, a difference of 0.10%), Soviet Union (6.6%, a difference of 0.22%), Comanche (6.7%, a difference of 0.23%), Immigrants from Congo (6.7%, a difference of 1.0%), and Taiwanese (6.6%, a difference of 1.5%).
| Demographics | Rating | Rank | Unemployment Among Seniors over 75 years |
| Cheyenne | 100.0 /100 | #3 | Exceptional 5.9% |
| Alsatians | 100.0 /100 | #4 | Exceptional 6.1% |
| Hopi | 100.0 /100 | #5 | Exceptional 6.3% |
| Immigrants | Armenia | 100.0 /100 | #6 | Exceptional 6.5% |
| Spanish American Indians | 100.0 /100 | #7 | Exceptional 6.5% |
| Taiwanese | 100.0 /100 | #8 | Exceptional 6.6% |
| Soviet Union | 100.0 /100 | #9 | Exceptional 6.6% |
| Yuman | 100.0 /100 | #10 | Exceptional 6.7% |
| Immigrants | Grenada | 100.0 /100 | #11 | Exceptional 6.7% |
| Comanche | 100.0 /100 | #12 | Exceptional 6.7% |
| Immigrants | Congo | 100.0 /100 | #13 | Exceptional 6.7% |
| Ute | 100.0 /100 | #14 | Exceptional 6.8% |
| Icelanders | 100.0 /100 | #15 | Exceptional 7.0% |
| Seminole | 100.0 /100 | #16 | Exceptional 7.1% |
| Immigrants | Switzerland | 100.0 /100 | #17 | Exceptional 7.2% |