Immigrants from Northern Africa vs Yuman Median Family Income
COMPARE
Immigrants from Northern Africa
Yuman
Median Family Income
Median Family Income Comparison
Immigrants from Northern Africa
Yuman
$108,161
MEDIAN FAMILY INCOME
94.3/ 100
METRIC RATING
120th/ 347
METRIC RANK
$78,055
MEDIAN FAMILY INCOME
0.0/ 100
METRIC RATING
337th/ 347
METRIC RANK
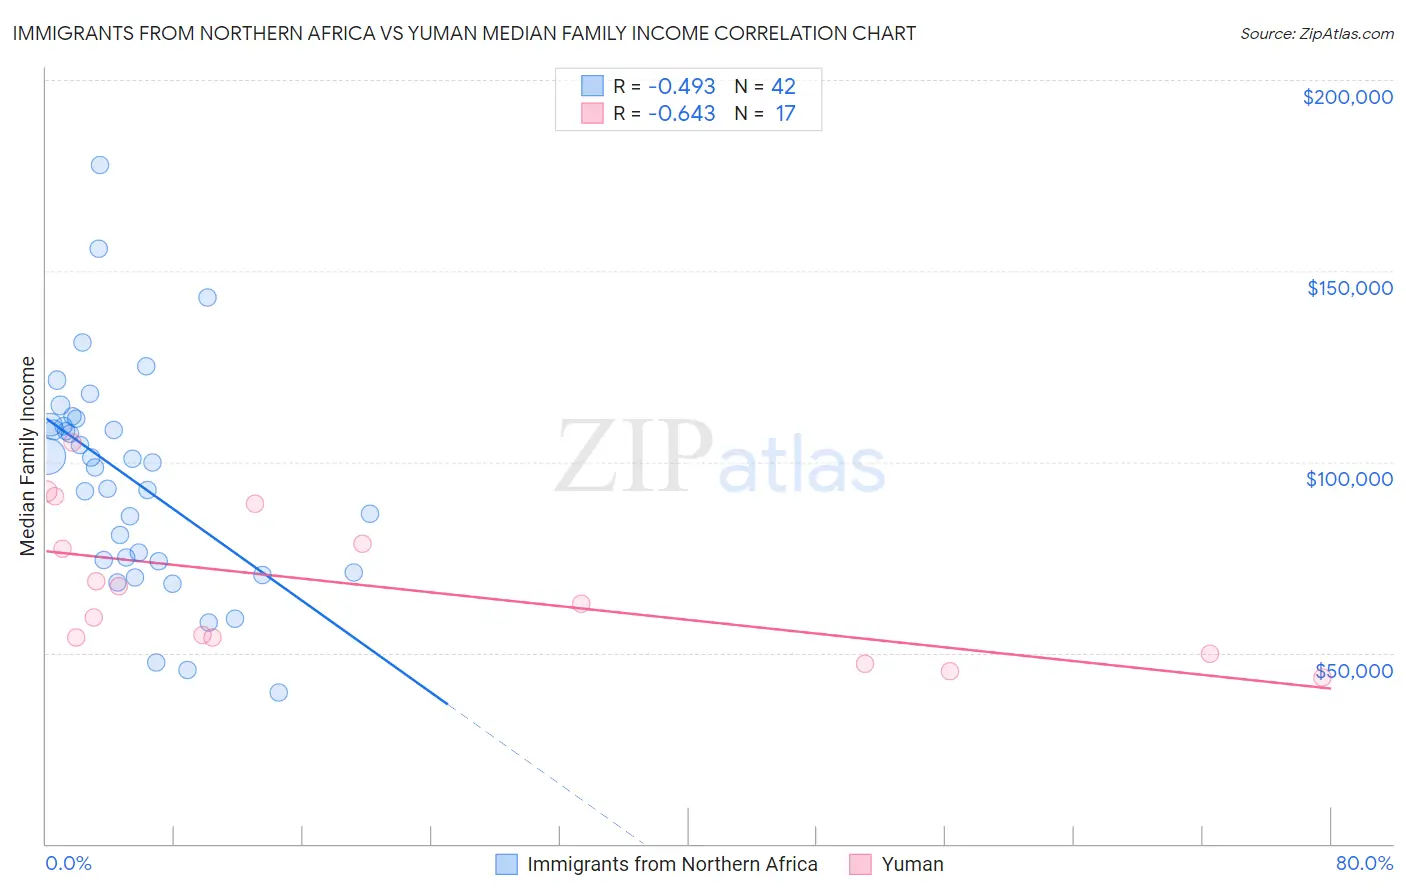
Immigrants from Northern Africa vs Yuman Median Family Income Correlation Chart
The statistical analysis conducted on geographies consisting of 321,028,181 people shows a moderate negative correlation between the proportion of Immigrants from Northern Africa and median family income in the United States with a correlation coefficient (R) of -0.493 and weighted average of $108,161. Similarly, the statistical analysis conducted on geographies consisting of 40,661,885 people shows a significant negative correlation between the proportion of Yuman and median family income in the United States with a correlation coefficient (R) of -0.643 and weighted average of $78,055, a difference of 38.6%.
Median Family Income Correlation Summary
| Measurement | Immigrants from Northern Africa | Yuman |
| Minimum | $39,712 | $43,500 |
| Maximum | $177,697 | $104,959 |
| Range | $137,985 | $61,459 |
| Mean | $95,107 | $67,052 |
| Median | $99,249 | $62,813 |
| Interquartile 25% (IQ1) | $74,063 | $51,959 |
| Interquartile 75% (IQ3) | $109,687 | $83,716 |
| Interquartile Range (IQR) | $35,624 | $31,757 |
| Standard Deviation (Sample) | $28,923 | $18,787 |
| Standard Deviation (Population) | $28,576 | $18,226 |
Similar Demographics by Median Family Income
Demographics Similar to Immigrants from Northern Africa by Median Family Income
In terms of median family income, the demographic groups most similar to Immigrants from Northern Africa are European ($108,099, a difference of 0.060%), Sri Lankan ($108,234, a difference of 0.070%), Ethiopian ($108,251, a difference of 0.080%), Immigrants from Philippines ($108,288, a difference of 0.12%), and Chilean ($108,429, a difference of 0.25%).
| Demographics | Rating | Rank | Median Family Income |
| Immigrants | Saudi Arabia | 95.2 /100 | #113 | Exceptional $108,544 |
| Poles | 95.2 /100 | #114 | Exceptional $108,507 |
| Swedes | 95.1 /100 | #115 | Exceptional $108,499 |
| Chileans | 95.0 /100 | #116 | Exceptional $108,429 |
| Immigrants | Philippines | 94.6 /100 | #117 | Exceptional $108,288 |
| Ethiopians | 94.5 /100 | #118 | Exceptional $108,251 |
| Sri Lankans | 94.5 /100 | #119 | Exceptional $108,234 |
| Immigrants | Northern Africa | 94.3 /100 | #120 | Exceptional $108,161 |
| Europeans | 94.1 /100 | #121 | Exceptional $108,099 |
| Immigrants | Jordan | 92.9 /100 | #122 | Exceptional $107,715 |
| Carpatho Rusyns | 92.2 /100 | #123 | Exceptional $107,502 |
| Pakistanis | 91.7 /100 | #124 | Exceptional $107,390 |
| Taiwanese | 91.4 /100 | #125 | Exceptional $107,295 |
| Serbians | 90.8 /100 | #126 | Exceptional $107,157 |
| Lebanese | 90.5 /100 | #127 | Exceptional $107,086 |
Demographics Similar to Yuman by Median Family Income
In terms of median family income, the demographic groups most similar to Yuman are Immigrants from Cuba ($78,249, a difference of 0.25%), Immigrants from Yemen ($77,457, a difference of 0.77%), Pima ($77,431, a difference of 0.80%), Hopi ($77,188, a difference of 1.1%), and Pueblo ($76,880, a difference of 1.5%).
| Demographics | Rating | Rank | Median Family Income |
| Cheyenne | 0.0 /100 | #330 | Tragic $81,385 |
| Immigrants | Dominican Republic | 0.0 /100 | #331 | Tragic $81,233 |
| Natives/Alaskans | 0.0 /100 | #332 | Tragic $80,908 |
| Kiowa | 0.0 /100 | #333 | Tragic $80,885 |
| Menominee | 0.0 /100 | #334 | Tragic $79,563 |
| Yup'ik | 0.0 /100 | #335 | Tragic $79,290 |
| Immigrants | Cuba | 0.0 /100 | #336 | Tragic $78,249 |
| Yuman | 0.0 /100 | #337 | Tragic $78,055 |
| Immigrants | Yemen | 0.0 /100 | #338 | Tragic $77,457 |
| Pima | 0.0 /100 | #339 | Tragic $77,431 |
| Hopi | 0.0 /100 | #340 | Tragic $77,188 |
| Pueblo | 0.0 /100 | #341 | Tragic $76,880 |
| Crow | 0.0 /100 | #342 | Tragic $76,605 |
| Houma | 0.0 /100 | #343 | Tragic $76,188 |
| Tohono O'odham | 0.0 /100 | #344 | Tragic $72,193 |