Immigrants from Korea vs South American Median Earnings
COMPARE
Immigrants from Korea
South American
Median Earnings
Median Earnings Comparison
Immigrants from Korea
South Americans
$54,530
MEDIAN EARNINGS
100.0/ 100
METRIC RATING
22nd/ 347
METRIC RANK
$46,804
MEDIAN EARNINGS
62.7/ 100
METRIC RATING
165th/ 347
METRIC RANK
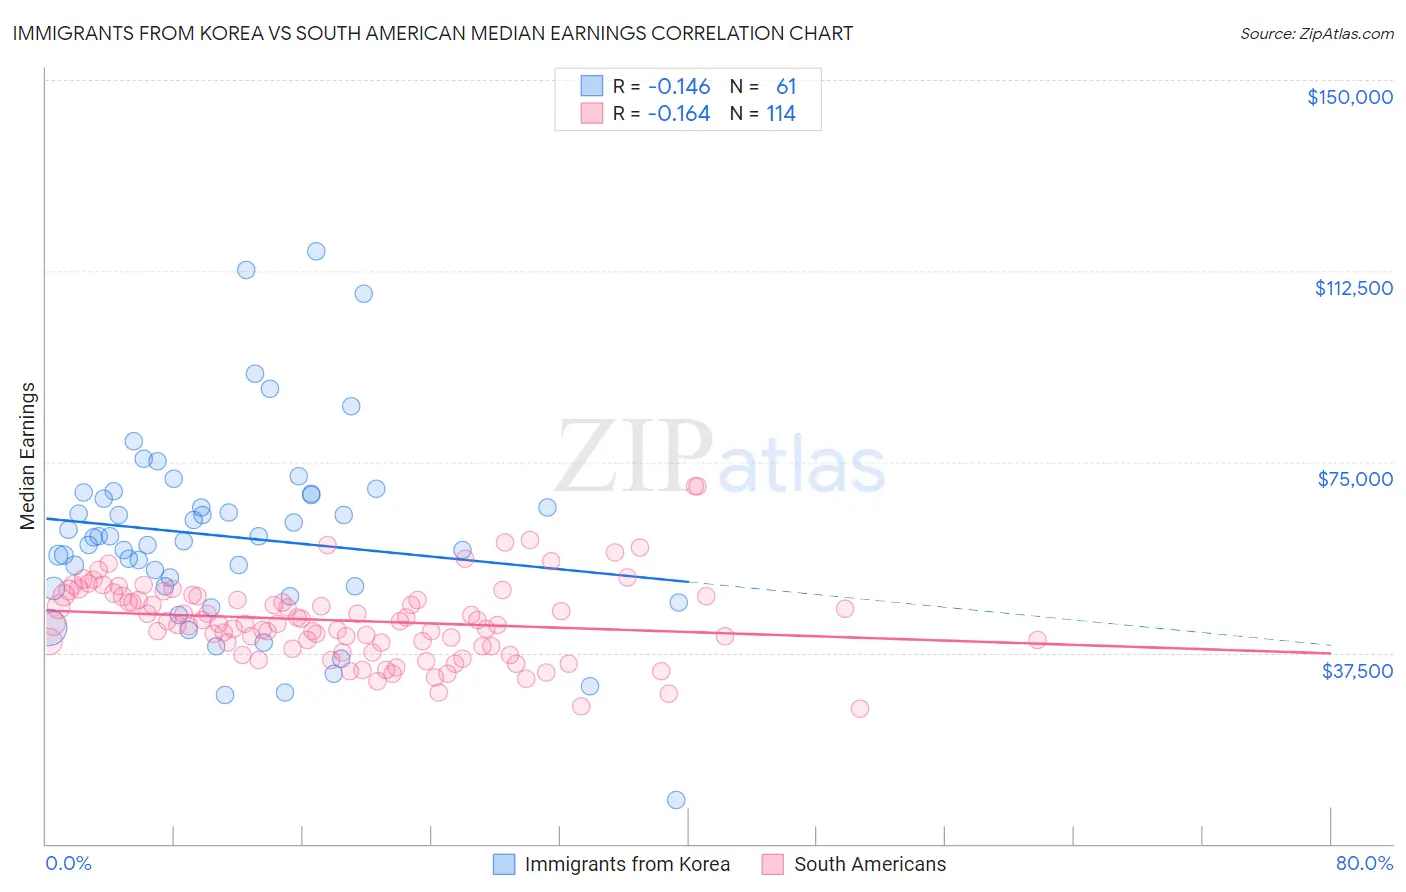
Immigrants from Korea vs South American Median Earnings Correlation Chart
The statistical analysis conducted on geographies consisting of 416,330,492 people shows a poor negative correlation between the proportion of Immigrants from Korea and median earnings in the United States with a correlation coefficient (R) of -0.146 and weighted average of $54,530. Similarly, the statistical analysis conducted on geographies consisting of 494,103,874 people shows a poor negative correlation between the proportion of South Americans and median earnings in the United States with a correlation coefficient (R) of -0.164 and weighted average of $46,804, a difference of 16.5%.
Median Earnings Correlation Summary
| Measurement | Immigrants from Korea | South American |
| Minimum | $8,707 | $26,500 |
| Maximum | $116,380 | $70,221 |
| Range | $107,673 | $43,721 |
| Mean | $60,321 | $43,826 |
| Median | $60,242 | $43,308 |
| Interquartile 25% (IQ1) | $50,376 | $38,802 |
| Interquartile 75% (IQ3) | $68,586 | $48,652 |
| Interquartile Range (IQR) | $18,211 | $9,850 |
| Standard Deviation (Sample) | $19,123 | $7,886 |
| Standard Deviation (Population) | $18,966 | $7,851 |
Similar Demographics by Median Earnings
Demographics Similar to Immigrants from Korea by Median Earnings
In terms of median earnings, the demographic groups most similar to Immigrants from Korea are Burmese ($54,559, a difference of 0.050%), Immigrants from Sweden ($54,478, a difference of 0.10%), Cypriot ($54,589, a difference of 0.11%), Immigrants from Belgium ($54,679, a difference of 0.27%), and Soviet Union ($54,290, a difference of 0.44%).
| Demographics | Rating | Rank | Median Earnings |
| Indians (Asian) | 100.0 /100 | #15 | Exceptional $56,253 |
| Immigrants | Eastern Asia | 100.0 /100 | #16 | Exceptional $56,183 |
| Eastern Europeans | 100.0 /100 | #17 | Exceptional $55,084 |
| Immigrants | Japan | 100.0 /100 | #18 | Exceptional $54,938 |
| Immigrants | Belgium | 100.0 /100 | #19 | Exceptional $54,679 |
| Cypriots | 100.0 /100 | #20 | Exceptional $54,589 |
| Burmese | 100.0 /100 | #21 | Exceptional $54,559 |
| Immigrants | Korea | 100.0 /100 | #22 | Exceptional $54,530 |
| Immigrants | Sweden | 100.0 /100 | #23 | Exceptional $54,478 |
| Soviet Union | 100.0 /100 | #24 | Exceptional $54,290 |
| Turks | 100.0 /100 | #25 | Exceptional $53,919 |
| Immigrants | Northern Europe | 100.0 /100 | #26 | Exceptional $53,872 |
| Asians | 100.0 /100 | #27 | Exceptional $53,690 |
| Immigrants | France | 100.0 /100 | #28 | Exceptional $53,490 |
| Immigrants | Russia | 100.0 /100 | #29 | Exceptional $53,457 |
Demographics Similar to South Americans by Median Earnings
In terms of median earnings, the demographic groups most similar to South Americans are Norwegian ($46,865, a difference of 0.13%), Icelander ($46,916, a difference of 0.24%), Czechoslovakian ($46,658, a difference of 0.31%), South American Indian ($46,952, a difference of 0.32%), and Costa Rican ($46,645, a difference of 0.34%).
| Demographics | Rating | Rank | Median Earnings |
| Slovaks | 71.7 /100 | #158 | Good $47,095 |
| Immigrants | Peru | 69.6 /100 | #159 | Good $47,025 |
| Alsatians | 69.6 /100 | #160 | Good $47,023 |
| Immigrants | Eastern Africa | 68.0 /100 | #161 | Good $46,969 |
| South American Indians | 67.4 /100 | #162 | Good $46,952 |
| Icelanders | 66.3 /100 | #163 | Good $46,916 |
| Norwegians | 64.7 /100 | #164 | Good $46,865 |
| South Americans | 62.7 /100 | #165 | Good $46,804 |
| Czechoslovakians | 57.8 /100 | #166 | Average $46,658 |
| Costa Ricans | 57.4 /100 | #167 | Average $46,645 |
| Immigrants | Africa | 54.6 /100 | #168 | Average $46,564 |
| Immigrants | South America | 54.0 /100 | #169 | Average $46,548 |
| Immigrants | Immigrants | 51.6 /100 | #170 | Average $46,478 |
| Scottish | 51.1 /100 | #171 | Average $46,463 |
| Kenyans | 51.0 /100 | #172 | Average $46,462 |