Immigrants from Burma/Myanmar vs South American Median Earnings
COMPARE
Immigrants from Burma/Myanmar
South American
Median Earnings
Median Earnings Comparison
Immigrants from Burma/Myanmar
South Americans
$43,998
MEDIAN EARNINGS
3.2/ 100
METRIC RATING
245th/ 347
METRIC RANK
$46,804
MEDIAN EARNINGS
62.7/ 100
METRIC RATING
165th/ 347
METRIC RANK
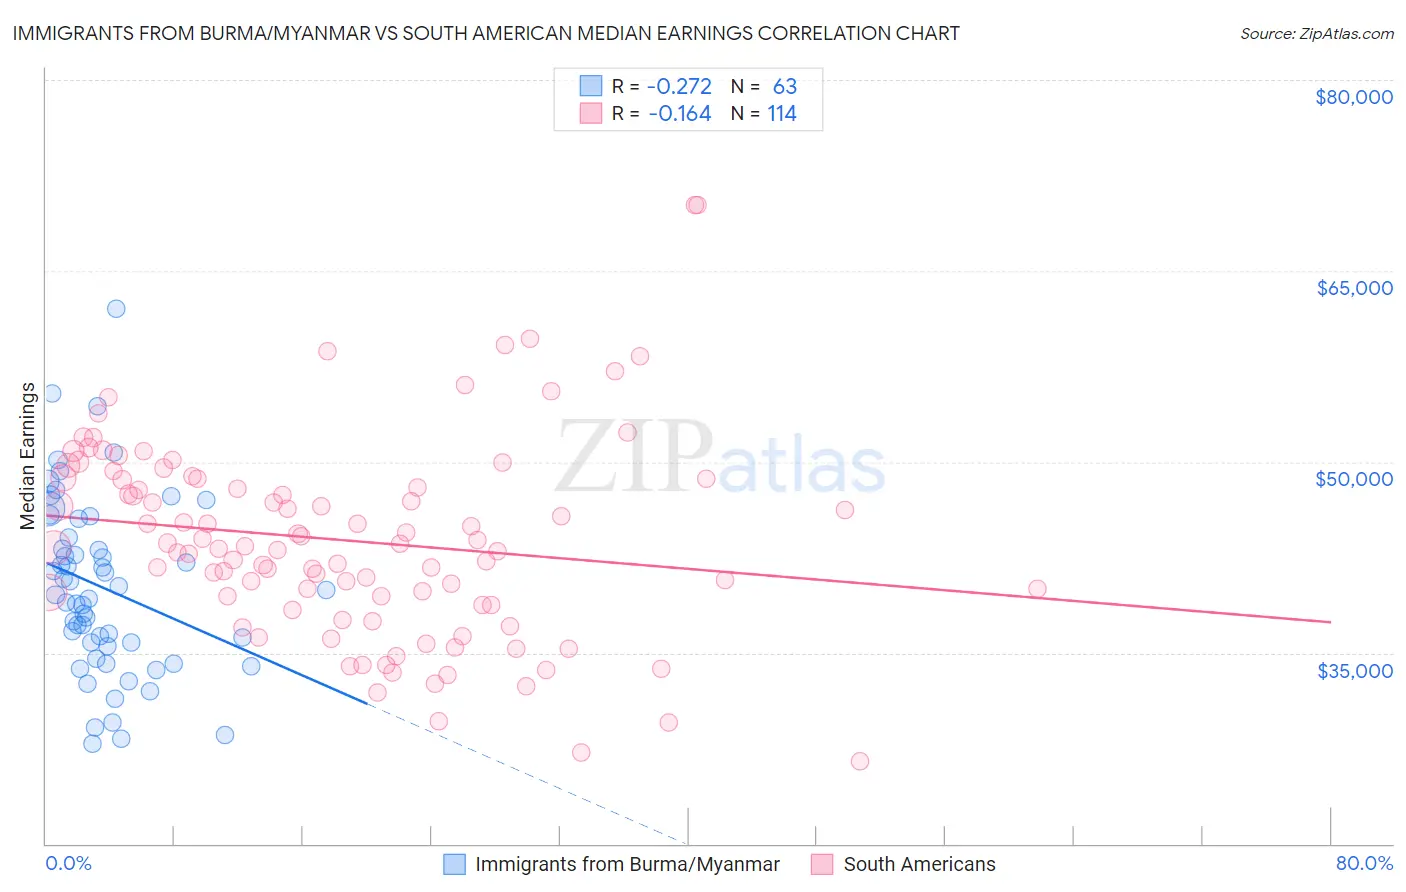
Immigrants from Burma/Myanmar vs South American Median Earnings Correlation Chart
The statistical analysis conducted on geographies consisting of 172,362,577 people shows a weak negative correlation between the proportion of Immigrants from Burma/Myanmar and median earnings in the United States with a correlation coefficient (R) of -0.272 and weighted average of $43,998. Similarly, the statistical analysis conducted on geographies consisting of 494,103,874 people shows a poor negative correlation between the proportion of South Americans and median earnings in the United States with a correlation coefficient (R) of -0.164 and weighted average of $46,804, a difference of 6.4%.
Median Earnings Correlation Summary
| Measurement | Immigrants from Burma/Myanmar | South American |
| Minimum | $27,898 | $26,500 |
| Maximum | $62,054 | $70,221 |
| Range | $34,156 | $43,721 |
| Mean | $40,087 | $43,826 |
| Median | $39,569 | $43,308 |
| Interquartile 25% (IQ1) | $35,543 | $38,802 |
| Interquartile 75% (IQ3) | $44,022 | $48,652 |
| Interquartile Range (IQR) | $8,479 | $9,850 |
| Standard Deviation (Sample) | $6,933 | $7,886 |
| Standard Deviation (Population) | $6,878 | $7,851 |
Similar Demographics by Median Earnings
Demographics Similar to Immigrants from Burma/Myanmar by Median Earnings
In terms of median earnings, the demographic groups most similar to Immigrants from Burma/Myanmar are Immigrants from West Indies ($43,989, a difference of 0.020%), Immigrants from Cabo Verde ($43,963, a difference of 0.080%), Subsaharan African ($44,118, a difference of 0.27%), Nonimmigrants ($44,117, a difference of 0.27%), and Nepalese ($43,860, a difference of 0.31%).
| Demographics | Rating | Rank | Median Earnings |
| Sudanese | 5.6 /100 | #238 | Tragic $44,419 |
| Senegalese | 5.3 /100 | #239 | Tragic $44,373 |
| Aleuts | 4.4 /100 | #240 | Tragic $44,241 |
| Samoans | 4.2 /100 | #241 | Tragic $44,206 |
| Immigrants | Venezuela | 4.0 /100 | #242 | Tragic $44,163 |
| Sub-Saharan Africans | 3.7 /100 | #243 | Tragic $44,118 |
| Immigrants | Nonimmigrants | 3.7 /100 | #244 | Tragic $44,117 |
| Immigrants | Burma/Myanmar | 3.2 /100 | #245 | Tragic $43,998 |
| Immigrants | West Indies | 3.1 /100 | #246 | Tragic $43,989 |
| Immigrants | Cabo Verde | 3.0 /100 | #247 | Tragic $43,963 |
| Nepalese | 2.6 /100 | #248 | Tragic $43,860 |
| Malaysians | 2.6 /100 | #249 | Tragic $43,844 |
| Alaska Natives | 2.3 /100 | #250 | Tragic $43,750 |
| Tsimshian | 2.1 /100 | #251 | Tragic $43,695 |
| Hawaiians | 2.0 /100 | #252 | Tragic $43,673 |
Demographics Similar to South Americans by Median Earnings
In terms of median earnings, the demographic groups most similar to South Americans are Norwegian ($46,865, a difference of 0.13%), Icelander ($46,916, a difference of 0.24%), Czechoslovakian ($46,658, a difference of 0.31%), South American Indian ($46,952, a difference of 0.32%), and Costa Rican ($46,645, a difference of 0.34%).
| Demographics | Rating | Rank | Median Earnings |
| Slovaks | 71.7 /100 | #158 | Good $47,095 |
| Immigrants | Peru | 69.6 /100 | #159 | Good $47,025 |
| Alsatians | 69.6 /100 | #160 | Good $47,023 |
| Immigrants | Eastern Africa | 68.0 /100 | #161 | Good $46,969 |
| South American Indians | 67.4 /100 | #162 | Good $46,952 |
| Icelanders | 66.3 /100 | #163 | Good $46,916 |
| Norwegians | 64.7 /100 | #164 | Good $46,865 |
| South Americans | 62.7 /100 | #165 | Good $46,804 |
| Czechoslovakians | 57.8 /100 | #166 | Average $46,658 |
| Costa Ricans | 57.4 /100 | #167 | Average $46,645 |
| Immigrants | Africa | 54.6 /100 | #168 | Average $46,564 |
| Immigrants | South America | 54.0 /100 | #169 | Average $46,548 |
| Immigrants | Immigrants | 51.6 /100 | #170 | Average $46,478 |
| Scottish | 51.1 /100 | #171 | Average $46,463 |
| Kenyans | 51.0 /100 | #172 | Average $46,462 |