Hopi vs Immigrants from England Median Family Income
COMPARE
Hopi
Immigrants from England
Median Family Income
Median Family Income Comparison
Hopi
Immigrants from England
$77,188
MEDIAN FAMILY INCOME
0.0/ 100
METRIC RATING
340th/ 347
METRIC RANK
$112,038
MEDIAN FAMILY INCOME
99.2/ 100
METRIC RATING
82nd/ 347
METRIC RANK
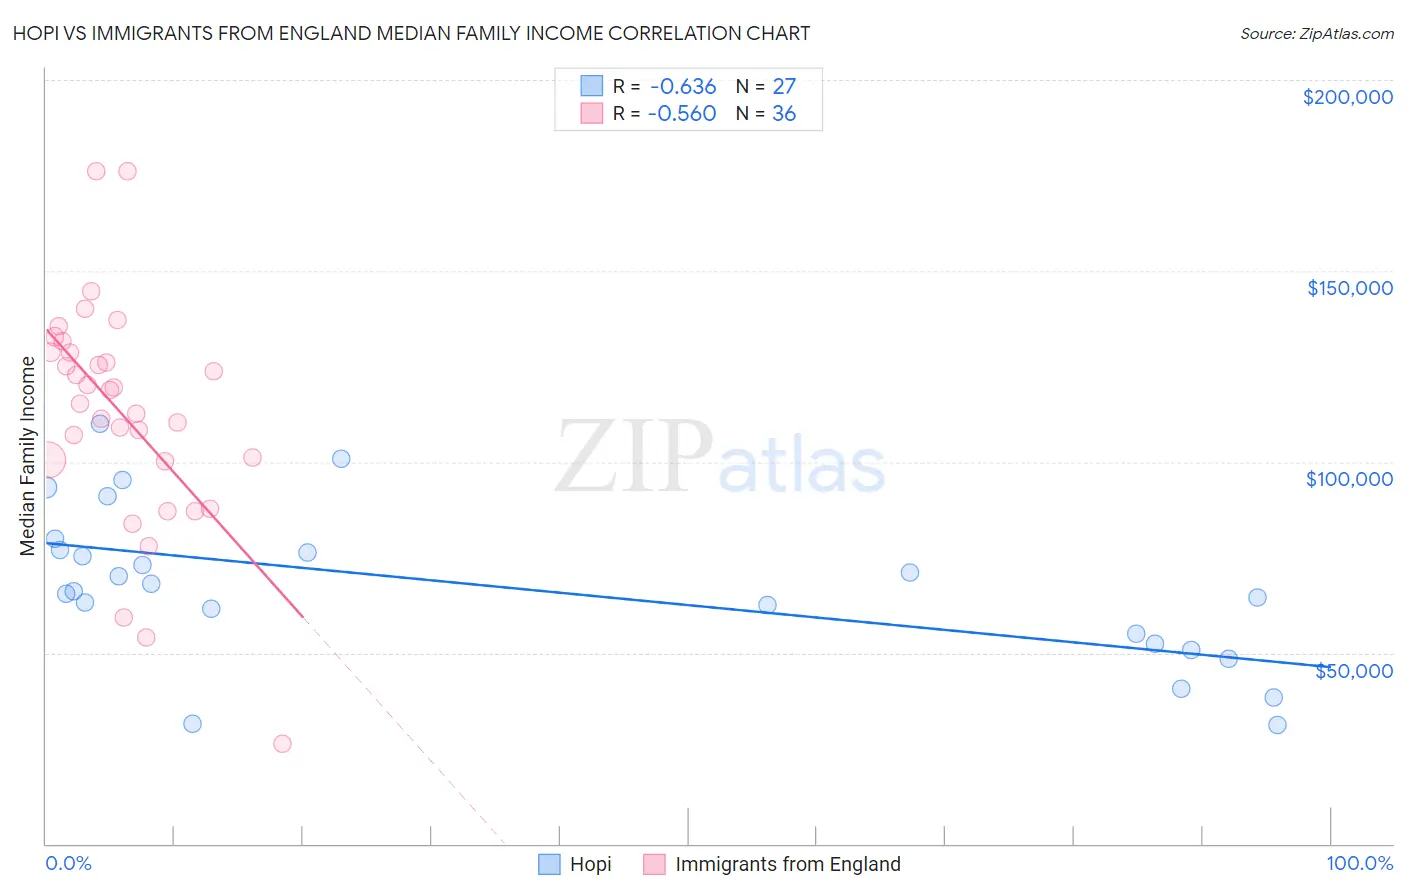
Hopi vs Immigrants from England Median Family Income Correlation Chart
The statistical analysis conducted on geographies consisting of 74,729,125 people shows a significant negative correlation between the proportion of Hopi and median family income in the United States with a correlation coefficient (R) of -0.636 and weighted average of $77,188. Similarly, the statistical analysis conducted on geographies consisting of 391,652,266 people shows a substantial negative correlation between the proportion of Immigrants from England and median family income in the United States with a correlation coefficient (R) of -0.560 and weighted average of $112,038, a difference of 45.2%.
Median Family Income Correlation Summary
| Measurement | Hopi | Immigrants from England |
| Minimum | $31,250 | $26,250 |
| Maximum | $109,922 | $176,139 |
| Range | $78,672 | $149,889 |
| Mean | $67,112 | $112,548 |
| Median | $66,093 | $117,120 |
| Interquartile 25% (IQ1) | $52,500 | $100,437 |
| Interquartile 75% (IQ3) | $76,955 | $128,664 |
| Interquartile Range (IQR) | $24,455 | $28,227 |
| Standard Deviation (Sample) | $20,243 | $29,901 |
| Standard Deviation (Population) | $19,865 | $29,483 |
Similar Demographics by Median Family Income
Demographics Similar to Hopi by Median Family Income
In terms of median family income, the demographic groups most similar to Hopi are Pima ($77,431, a difference of 0.32%), Immigrants from Yemen ($77,457, a difference of 0.35%), Pueblo ($76,880, a difference of 0.40%), Crow ($76,605, a difference of 0.76%), and Yuman ($78,055, a difference of 1.1%).
| Demographics | Rating | Rank | Median Family Income |
| Kiowa | 0.0 /100 | #333 | Tragic $80,885 |
| Menominee | 0.0 /100 | #334 | Tragic $79,563 |
| Yup'ik | 0.0 /100 | #335 | Tragic $79,290 |
| Immigrants | Cuba | 0.0 /100 | #336 | Tragic $78,249 |
| Yuman | 0.0 /100 | #337 | Tragic $78,055 |
| Immigrants | Yemen | 0.0 /100 | #338 | Tragic $77,457 |
| Pima | 0.0 /100 | #339 | Tragic $77,431 |
| Hopi | 0.0 /100 | #340 | Tragic $77,188 |
| Pueblo | 0.0 /100 | #341 | Tragic $76,880 |
| Crow | 0.0 /100 | #342 | Tragic $76,605 |
| Houma | 0.0 /100 | #343 | Tragic $76,188 |
| Tohono O'odham | 0.0 /100 | #344 | Tragic $72,193 |
| Navajo | 0.0 /100 | #345 | Tragic $70,989 |
| Puerto Ricans | 0.0 /100 | #346 | Tragic $70,423 |
| Lumbee | 0.0 /100 | #347 | Tragic $68,679 |
Demographics Similar to Immigrants from England by Median Family Income
In terms of median family income, the demographic groups most similar to Immigrants from England are Immigrants from North America ($112,151, a difference of 0.10%), Immigrants from Croatia ($112,323, a difference of 0.25%), Immigrants from Canada ($112,374, a difference of 0.30%), Italian ($112,372, a difference of 0.30%), and Immigrants from Egypt ($111,689, a difference of 0.31%).
| Demographics | Rating | Rank | Median Family Income |
| Immigrants | Western Europe | 99.4 /100 | #75 | Exceptional $112,688 |
| Argentineans | 99.4 /100 | #76 | Exceptional $112,665 |
| Immigrants | Eastern Europe | 99.4 /100 | #77 | Exceptional $112,527 |
| Immigrants | Canada | 99.3 /100 | #78 | Exceptional $112,374 |
| Italians | 99.3 /100 | #79 | Exceptional $112,372 |
| Immigrants | Croatia | 99.3 /100 | #80 | Exceptional $112,323 |
| Immigrants | North America | 99.2 /100 | #81 | Exceptional $112,151 |
| Immigrants | England | 99.2 /100 | #82 | Exceptional $112,038 |
| Immigrants | Egypt | 99.0 /100 | #83 | Exceptional $111,689 |
| Immigrants | Hungary | 98.8 /100 | #84 | Exceptional $111,378 |
| Croatians | 98.8 /100 | #85 | Exceptional $111,370 |
| Ukrainians | 98.8 /100 | #86 | Exceptional $111,368 |
| Austrians | 98.8 /100 | #87 | Exceptional $111,306 |
| Romanians | 98.8 /100 | #88 | Exceptional $111,243 |
| Immigrants | Argentina | 98.5 /100 | #89 | Exceptional $110,873 |