Greek vs Immigrants from England Median Family Income
COMPARE
Greek
Immigrants from England
Median Family Income
Median Family Income Comparison
Greeks
Immigrants from England
$115,192
MEDIAN FAMILY INCOME
99.8/ 100
METRIC RATING
57th/ 347
METRIC RANK
$112,038
MEDIAN FAMILY INCOME
99.2/ 100
METRIC RATING
82nd/ 347
METRIC RANK
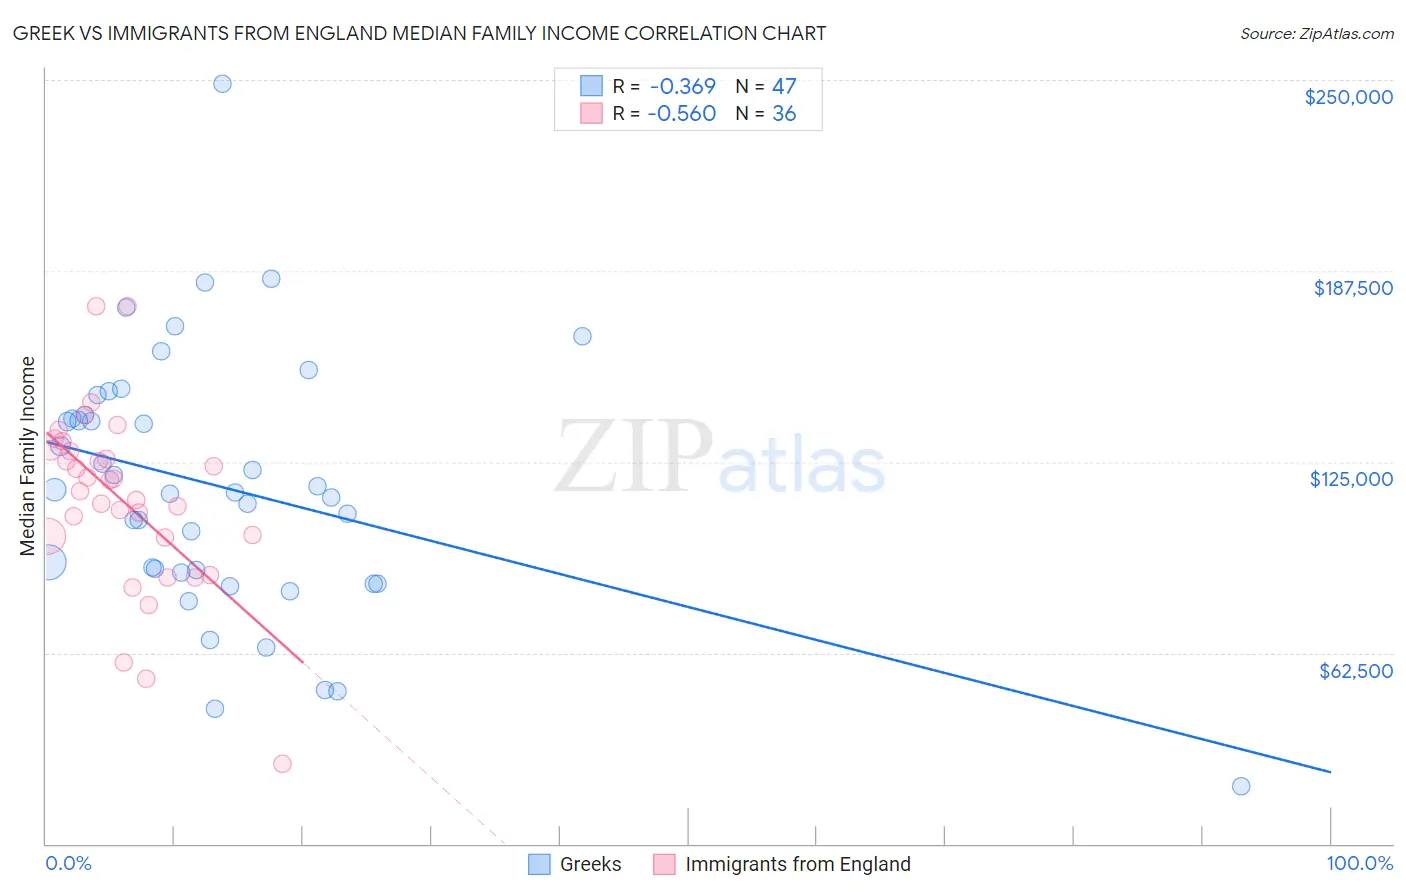
Greek vs Immigrants from England Median Family Income Correlation Chart
The statistical analysis conducted on geographies consisting of 482,131,670 people shows a mild negative correlation between the proportion of Greeks and median family income in the United States with a correlation coefficient (R) of -0.369 and weighted average of $115,192. Similarly, the statistical analysis conducted on geographies consisting of 391,652,266 people shows a substantial negative correlation between the proportion of Immigrants from England and median family income in the United States with a correlation coefficient (R) of -0.560 and weighted average of $112,038, a difference of 2.8%.
Median Family Income Correlation Summary
| Measurement | Greek | Immigrants from England |
| Minimum | $18,825 | $26,250 |
| Maximum | $248,750 | $176,139 |
| Range | $229,925 | $149,889 |
| Mean | $116,811 | $112,548 |
| Median | $115,024 | $117,120 |
| Interquartile 25% (IQ1) | $88,890 | $100,437 |
| Interquartile 75% (IQ3) | $140,272 | $128,664 |
| Interquartile Range (IQR) | $51,382 | $28,227 |
| Standard Deviation (Sample) | $42,578 | $29,901 |
| Standard Deviation (Population) | $42,122 | $29,483 |
Similar Demographics by Median Family Income
Demographics Similar to Greeks by Median Family Income
In terms of median family income, the demographic groups most similar to Greeks are New Zealander ($115,230, a difference of 0.030%), Immigrants from Indonesia ($115,162, a difference of 0.030%), Lithuanian ($115,395, a difference of 0.18%), Immigrants from Netherlands ($114,987, a difference of 0.18%), and Immigrants from Europe ($115,523, a difference of 0.29%).
| Demographics | Rating | Rank | Median Family Income |
| Immigrants | Czechoslovakia | 99.9 /100 | #50 | Exceptional $116,165 |
| Immigrants | Malaysia | 99.9 /100 | #51 | Exceptional $115,880 |
| Maltese | 99.9 /100 | #52 | Exceptional $115,862 |
| Immigrants | Norway | 99.9 /100 | #53 | Exceptional $115,847 |
| Immigrants | Europe | 99.9 /100 | #54 | Exceptional $115,523 |
| Lithuanians | 99.8 /100 | #55 | Exceptional $115,395 |
| New Zealanders | 99.8 /100 | #56 | Exceptional $115,230 |
| Greeks | 99.8 /100 | #57 | Exceptional $115,192 |
| Immigrants | Indonesia | 99.8 /100 | #58 | Exceptional $115,162 |
| Immigrants | Netherlands | 99.8 /100 | #59 | Exceptional $114,987 |
| Immigrants | Latvia | 99.8 /100 | #60 | Exceptional $114,826 |
| Immigrants | Belarus | 99.8 /100 | #61 | Exceptional $114,586 |
| Mongolians | 99.8 /100 | #62 | Exceptional $114,553 |
| Immigrants | Pakistan | 99.8 /100 | #63 | Exceptional $114,406 |
| Immigrants | Scotland | 99.7 /100 | #64 | Exceptional $114,392 |
Demographics Similar to Immigrants from England by Median Family Income
In terms of median family income, the demographic groups most similar to Immigrants from England are Immigrants from North America ($112,151, a difference of 0.10%), Immigrants from Croatia ($112,323, a difference of 0.25%), Immigrants from Canada ($112,374, a difference of 0.30%), Italian ($112,372, a difference of 0.30%), and Immigrants from Egypt ($111,689, a difference of 0.31%).
| Demographics | Rating | Rank | Median Family Income |
| Immigrants | Western Europe | 99.4 /100 | #75 | Exceptional $112,688 |
| Argentineans | 99.4 /100 | #76 | Exceptional $112,665 |
| Immigrants | Eastern Europe | 99.4 /100 | #77 | Exceptional $112,527 |
| Immigrants | Canada | 99.3 /100 | #78 | Exceptional $112,374 |
| Italians | 99.3 /100 | #79 | Exceptional $112,372 |
| Immigrants | Croatia | 99.3 /100 | #80 | Exceptional $112,323 |
| Immigrants | North America | 99.2 /100 | #81 | Exceptional $112,151 |
| Immigrants | England | 99.2 /100 | #82 | Exceptional $112,038 |
| Immigrants | Egypt | 99.0 /100 | #83 | Exceptional $111,689 |
| Immigrants | Hungary | 98.8 /100 | #84 | Exceptional $111,378 |
| Croatians | 98.8 /100 | #85 | Exceptional $111,370 |
| Ukrainians | 98.8 /100 | #86 | Exceptional $111,368 |
| Austrians | 98.8 /100 | #87 | Exceptional $111,306 |
| Romanians | 98.8 /100 | #88 | Exceptional $111,243 |
| Immigrants | Argentina | 98.5 /100 | #89 | Exceptional $110,873 |