Italian vs Colombian Median Earnings
COMPARE
Italian
Colombian
Median Earnings
Median Earnings Comparison
Italians
Colombians
$49,915
MEDIAN EARNINGS
99.3/ 100
METRIC RATING
90th/ 347
METRIC RANK
$46,349
MEDIAN EARNINGS
47.1/ 100
METRIC RATING
178th/ 347
METRIC RANK
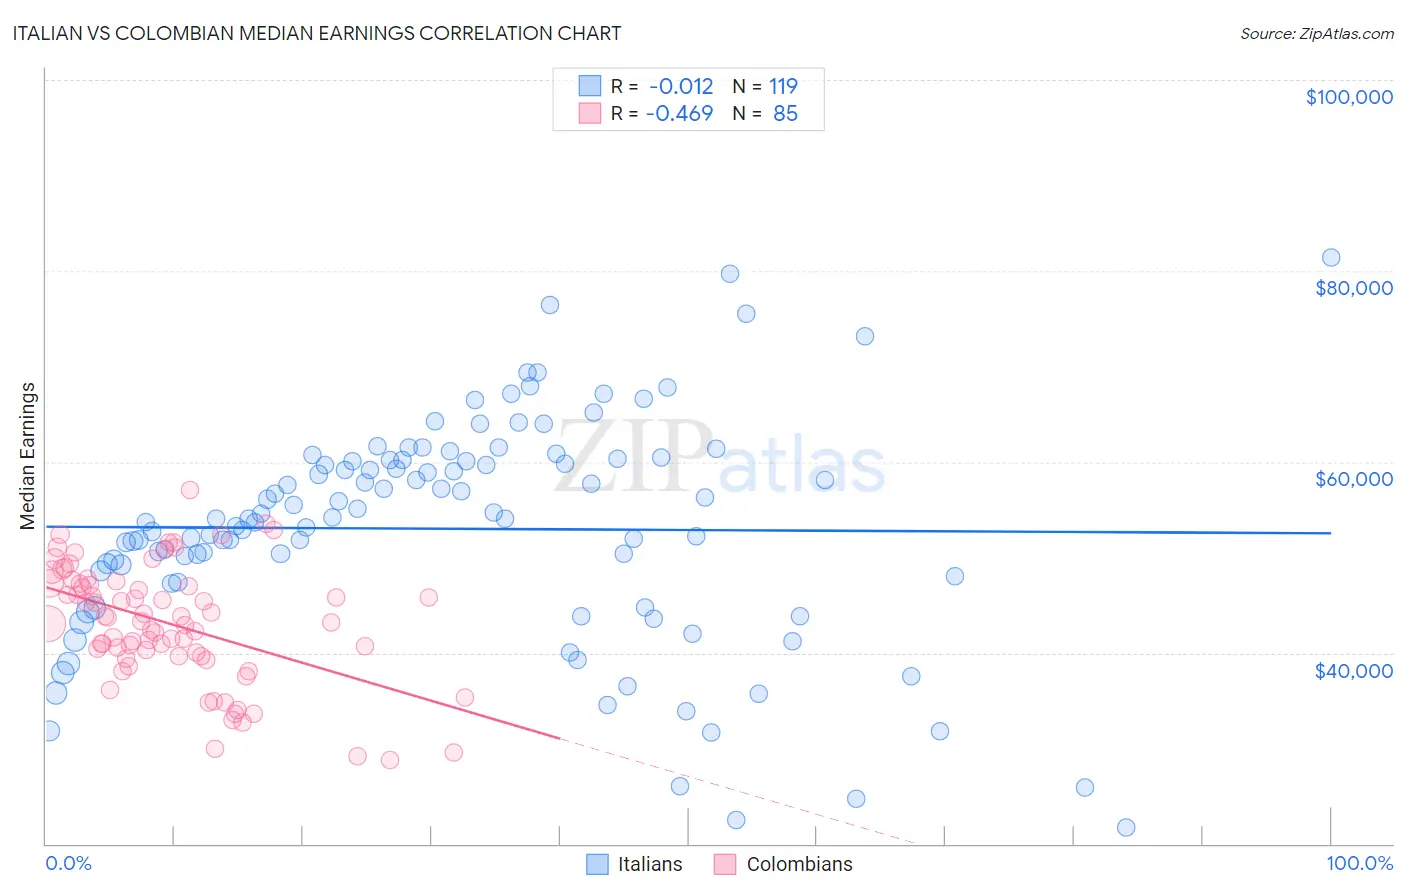
Italian vs Colombian Median Earnings Correlation Chart
The statistical analysis conducted on geographies consisting of 574,669,176 people shows no correlation between the proportion of Italians and median earnings in the United States with a correlation coefficient (R) of -0.012 and weighted average of $49,915. Similarly, the statistical analysis conducted on geographies consisting of 419,670,347 people shows a moderate negative correlation between the proportion of Colombians and median earnings in the United States with a correlation coefficient (R) of -0.469 and weighted average of $46,349, a difference of 7.7%.
Median Earnings Correlation Summary
| Measurement | Italian | Colombian |
| Minimum | $21,728 | $28,750 |
| Maximum | $81,458 | $57,032 |
| Range | $59,730 | $28,282 |
| Mean | $52,992 | $43,048 |
| Median | $54,091 | $43,271 |
| Interquartile 25% (IQ1) | $47,401 | $39,637 |
| Interquartile 75% (IQ3) | $60,200 | $47,254 |
| Interquartile Range (IQR) | $12,799 | $7,617 |
| Standard Deviation (Sample) | $11,690 | $6,158 |
| Standard Deviation (Population) | $11,640 | $6,121 |
Similar Demographics by Median Earnings
Demographics Similar to Italians by Median Earnings
In terms of median earnings, the demographic groups most similar to Italians are Macedonian ($49,893, a difference of 0.040%), Immigrants from Argentina ($49,841, a difference of 0.15%), Armenian ($49,804, a difference of 0.22%), Croatian ($49,724, a difference of 0.38%), and Immigrants from North America ($50,108, a difference of 0.39%).
| Demographics | Rating | Rank | Median Earnings |
| Romanians | 99.5 /100 | #83 | Exceptional $50,244 |
| Immigrants | Hungary | 99.5 /100 | #84 | Exceptional $50,227 |
| Immigrants | Kazakhstan | 99.5 /100 | #85 | Exceptional $50,225 |
| Immigrants | Canada | 99.5 /100 | #86 | Exceptional $50,192 |
| Immigrants | Uzbekistan | 99.5 /100 | #87 | Exceptional $50,151 |
| Albanians | 99.4 /100 | #88 | Exceptional $50,116 |
| Immigrants | North America | 99.4 /100 | #89 | Exceptional $50,108 |
| Italians | 99.3 /100 | #90 | Exceptional $49,915 |
| Macedonians | 99.2 /100 | #91 | Exceptional $49,893 |
| Immigrants | Argentina | 99.2 /100 | #92 | Exceptional $49,841 |
| Armenians | 99.1 /100 | #93 | Exceptional $49,804 |
| Croatians | 99.0 /100 | #94 | Exceptional $49,724 |
| Immigrants | England | 99.0 /100 | #95 | Exceptional $49,722 |
| Immigrants | Lebanon | 99.0 /100 | #96 | Exceptional $49,682 |
| Immigrants | North Macedonia | 98.9 /100 | #97 | Exceptional $49,658 |
Demographics Similar to Colombians by Median Earnings
In terms of median earnings, the demographic groups most similar to Colombians are English ($46,334, a difference of 0.030%), Puget Sound Salish ($46,333, a difference of 0.040%), Immigrants from Cameroon ($46,329, a difference of 0.040%), Belgian ($46,375, a difference of 0.060%), and Swiss ($46,315, a difference of 0.070%).
| Demographics | Rating | Rank | Median Earnings |
| Scottish | 51.1 /100 | #171 | Average $46,463 |
| Kenyans | 51.0 /100 | #172 | Average $46,462 |
| Ghanaians | 50.3 /100 | #173 | Average $46,440 |
| Scandinavians | 50.0 /100 | #174 | Average $46,433 |
| Basques | 48.8 /100 | #175 | Average $46,399 |
| Danes | 48.6 /100 | #176 | Average $46,392 |
| Belgians | 48.0 /100 | #177 | Average $46,375 |
| Colombians | 47.1 /100 | #178 | Average $46,349 |
| English | 46.5 /100 | #179 | Average $46,334 |
| Puget Sound Salish | 46.5 /100 | #180 | Average $46,333 |
| Immigrants | Cameroon | 46.4 /100 | #181 | Average $46,329 |
| Swiss | 45.9 /100 | #182 | Average $46,315 |
| French | 45.2 /100 | #183 | Average $46,296 |
| Immigrants | Kenya | 42.4 /100 | #184 | Average $46,214 |
| Uruguayans | 41.6 /100 | #185 | Average $46,190 |