Immigrants from Syria vs Yugoslavian Median Earnings
COMPARE
Immigrants from Syria
Yugoslavian
Median Earnings
Median Earnings Comparison
Immigrants from Syria
Yugoslavians
$48,375
MEDIAN EARNINGS
93.9/ 100
METRIC RATING
123rd/ 347
METRIC RANK
$45,846
MEDIAN EARNINGS
30.5/ 100
METRIC RATING
196th/ 347
METRIC RANK
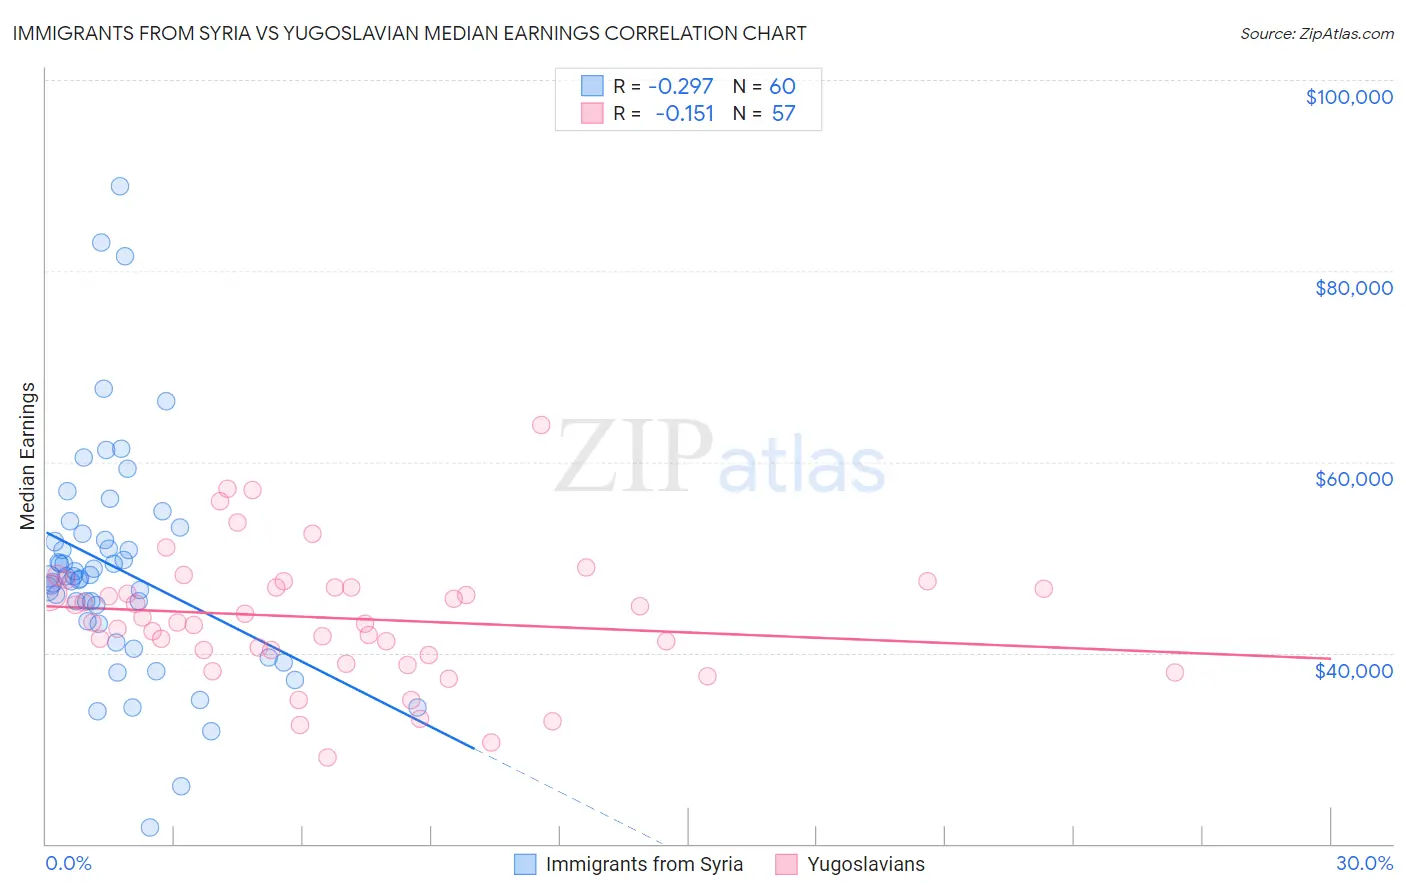
Immigrants from Syria vs Yugoslavian Median Earnings Correlation Chart
The statistical analysis conducted on geographies consisting of 174,102,272 people shows a weak negative correlation between the proportion of Immigrants from Syria and median earnings in the United States with a correlation coefficient (R) of -0.297 and weighted average of $48,375. Similarly, the statistical analysis conducted on geographies consisting of 285,700,192 people shows a poor negative correlation between the proportion of Yugoslavians and median earnings in the United States with a correlation coefficient (R) of -0.151 and weighted average of $45,846, a difference of 5.5%.
Median Earnings Correlation Summary
| Measurement | Immigrants from Syria | Yugoslavian |
| Minimum | $21,696 | $29,039 |
| Maximum | $88,902 | $63,892 |
| Range | $67,206 | $34,853 |
| Mean | $48,829 | $43,647 |
| Median | $48,019 | $43,187 |
| Interquartile 25% (IQ1) | $43,163 | $39,984 |
| Interquartile 75% (IQ3) | $52,131 | $46,857 |
| Interquartile Range (IQR) | $8,968 | $6,873 |
| Standard Deviation (Sample) | $12,024 | $6,694 |
| Standard Deviation (Population) | $11,923 | $6,635 |
Similar Demographics by Median Earnings
Demographics Similar to Immigrants from Syria by Median Earnings
In terms of median earnings, the demographic groups most similar to Immigrants from Syria are Brazilian ($48,356, a difference of 0.040%), Immigrants from Fiji ($48,305, a difference of 0.14%), Assyrian/Chaldean/Syriac ($48,304, a difference of 0.15%), Sierra Leonean ($48,286, a difference of 0.19%), and Immigrants from Philippines ($48,266, a difference of 0.23%).
| Demographics | Rating | Rank | Median Earnings |
| Koreans | 96.2 /100 | #116 | Exceptional $48,727 |
| Serbians | 95.9 /100 | #117 | Exceptional $48,677 |
| Immigrants | Jordan | 95.9 /100 | #118 | Exceptional $48,673 |
| Poles | 95.8 /100 | #119 | Exceptional $48,659 |
| Carpatho Rusyns | 95.5 /100 | #120 | Exceptional $48,617 |
| Arabs | 95.4 /100 | #121 | Exceptional $48,599 |
| Chileans | 94.8 /100 | #122 | Exceptional $48,504 |
| Immigrants | Syria | 93.9 /100 | #123 | Exceptional $48,375 |
| Brazilians | 93.7 /100 | #124 | Exceptional $48,356 |
| Immigrants | Fiji | 93.3 /100 | #125 | Exceptional $48,305 |
| Assyrians/Chaldeans/Syriacs | 93.3 /100 | #126 | Exceptional $48,304 |
| Sierra Leoneans | 93.1 /100 | #127 | Exceptional $48,286 |
| Immigrants | Philippines | 92.9 /100 | #128 | Exceptional $48,266 |
| Pakistanis | 92.8 /100 | #129 | Exceptional $48,254 |
| Zimbabweans | 92.6 /100 | #130 | Exceptional $48,229 |
Demographics Similar to Yugoslavians by Median Earnings
In terms of median earnings, the demographic groups most similar to Yugoslavians are Barbadian ($45,846, a difference of 0.0%), Trinidadian and Tobagonian ($45,820, a difference of 0.060%), Immigrants from Barbados ($45,816, a difference of 0.070%), Immigrants from the Azores ($45,812, a difference of 0.070%), and Immigrants from St. Vincent and the Grenadines ($45,908, a difference of 0.13%).
| Demographics | Rating | Rank | Median Earnings |
| Spaniards | 37.2 /100 | #189 | Fair $46,059 |
| French Canadians | 36.1 /100 | #190 | Fair $46,026 |
| Finns | 33.4 /100 | #191 | Fair $45,940 |
| Germans | 33.2 /100 | #192 | Fair $45,935 |
| Guamanians/Chamorros | 33.2 /100 | #193 | Fair $45,933 |
| Immigrants | Costa Rica | 33.0 /100 | #194 | Fair $45,928 |
| Immigrants | St. Vincent and the Grenadines | 32.4 /100 | #195 | Fair $45,908 |
| Yugoslavians | 30.5 /100 | #196 | Fair $45,846 |
| Barbadians | 30.5 /100 | #197 | Fair $45,846 |
| Trinidadians and Tobagonians | 29.7 /100 | #198 | Fair $45,820 |
| Immigrants | Barbados | 29.6 /100 | #199 | Fair $45,816 |
| Immigrants | Azores | 29.5 /100 | #200 | Fair $45,812 |
| Celtics | 27.2 /100 | #201 | Fair $45,732 |
| Immigrants | Trinidad and Tobago | 27.1 /100 | #202 | Fair $45,729 |
| Welsh | 26.6 /100 | #203 | Fair $45,710 |