Polish vs Senegalese Median Household Income
COMPARE
Polish
Senegalese
Median Household Income
Median Household Income Comparison
Poles
Senegalese
$88,472
MEDIAN HOUSEHOLD INCOME
89.7/ 100
METRIC RATING
136th/ 347
METRIC RANK
$74,999
MEDIAN HOUSEHOLD INCOME
0.2/ 100
METRIC RATING
280th/ 347
METRIC RANK
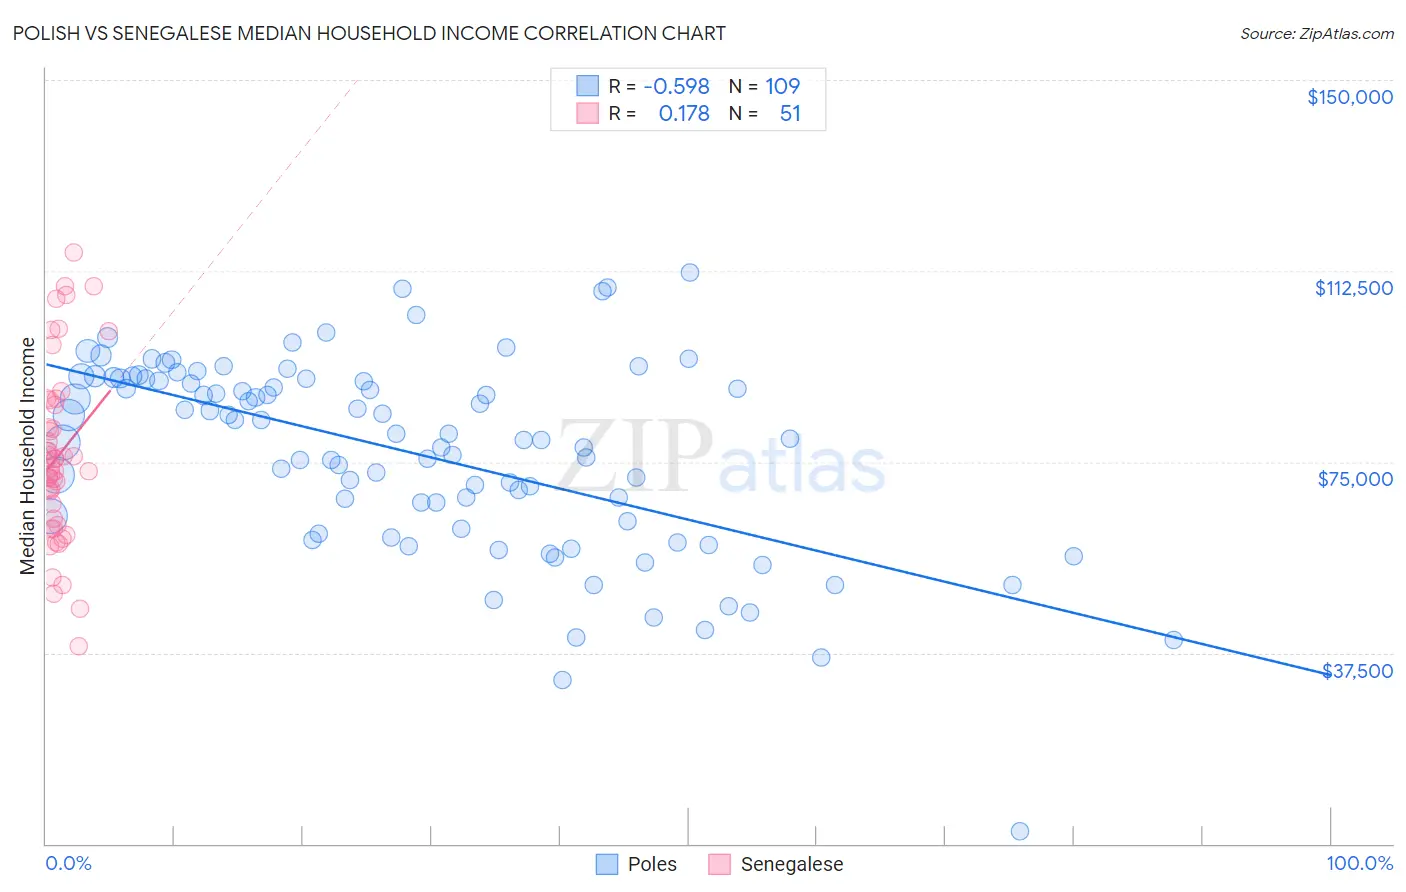
Polish vs Senegalese Median Household Income Correlation Chart
The statistical analysis conducted on geographies consisting of 559,571,407 people shows a substantial negative correlation between the proportion of Poles and median household income in the United States with a correlation coefficient (R) of -0.598 and weighted average of $88,472. Similarly, the statistical analysis conducted on geographies consisting of 78,073,894 people shows a poor positive correlation between the proportion of Senegalese and median household income in the United States with a correlation coefficient (R) of 0.178 and weighted average of $74,999, a difference of 18.0%.
Median Household Income Correlation Summary
| Measurement | Polish | Senegalese |
| Minimum | $2,499 | $38,686 |
| Maximum | $112,083 | $116,116 |
| Range | $109,584 | $77,430 |
| Mean | $76,577 | $76,167 |
| Median | $79,444 | $74,286 |
| Interquartile 25% (IQ1) | $62,696 | $62,685 |
| Interquartile 75% (IQ3) | $91,347 | $87,125 |
| Interquartile Range (IQR) | $28,651 | $24,440 |
| Standard Deviation (Sample) | $19,210 | $17,624 |
| Standard Deviation (Population) | $19,121 | $17,451 |
Similar Demographics by Median Household Income
Demographics Similar to Poles by Median Household Income
In terms of median household income, the demographic groups most similar to Poles are Sierra Leonean ($88,463, a difference of 0.010%), Immigrants from Sierra Leone ($88,498, a difference of 0.030%), Swedish ($88,524, a difference of 0.060%), Arab ($88,398, a difference of 0.080%), and Immigrants from Chile ($88,388, a difference of 0.090%).
| Demographics | Rating | Rank | Median Household Income |
| Brazilians | 92.1 /100 | #129 | Exceptional $88,934 |
| British | 92.0 /100 | #130 | Exceptional $88,914 |
| Immigrants | Syria | 91.4 /100 | #131 | Exceptional $88,792 |
| Europeans | 91.2 /100 | #132 | Exceptional $88,751 |
| Immigrants | Ethiopia | 90.9 /100 | #133 | Exceptional $88,687 |
| Swedes | 90.0 /100 | #134 | Exceptional $88,524 |
| Immigrants | Sierra Leone | 89.9 /100 | #135 | Excellent $88,498 |
| Poles | 89.7 /100 | #136 | Excellent $88,472 |
| Sierra Leoneans | 89.6 /100 | #137 | Excellent $88,463 |
| Arabs | 89.2 /100 | #138 | Excellent $88,398 |
| Immigrants | Chile | 89.2 /100 | #139 | Excellent $88,388 |
| Lebanese | 87.2 /100 | #140 | Excellent $88,091 |
| Immigrants | Morocco | 86.0 /100 | #141 | Excellent $87,930 |
| Canadians | 84.7 /100 | #142 | Excellent $87,769 |
| Danes | 83.9 /100 | #143 | Excellent $87,676 |
Demographics Similar to Senegalese by Median Household Income
In terms of median household income, the demographic groups most similar to Senegalese are Immigrants from Liberia ($74,896, a difference of 0.14%), Immigrants from Guatemala ($75,123, a difference of 0.16%), Central American Indian ($74,847, a difference of 0.20%), Osage ($75,240, a difference of 0.32%), and Cree ($74,685, a difference of 0.42%).
| Demographics | Rating | Rank | Median Household Income |
| Liberians | 0.2 /100 | #273 | Tragic $75,667 |
| British West Indians | 0.2 /100 | #274 | Tragic $75,647 |
| Immigrants | Micronesia | 0.2 /100 | #275 | Tragic $75,574 |
| Immigrants | Latin America | 0.2 /100 | #276 | Tragic $75,420 |
| Spanish Americans | 0.2 /100 | #277 | Tragic $75,386 |
| Osage | 0.2 /100 | #278 | Tragic $75,240 |
| Immigrants | Guatemala | 0.2 /100 | #279 | Tragic $75,123 |
| Senegalese | 0.2 /100 | #280 | Tragic $74,999 |
| Immigrants | Liberia | 0.1 /100 | #281 | Tragic $74,896 |
| Central American Indians | 0.1 /100 | #282 | Tragic $74,847 |
| Cree | 0.1 /100 | #283 | Tragic $74,685 |
| Yaqui | 0.1 /100 | #284 | Tragic $74,596 |
| Mexicans | 0.1 /100 | #285 | Tragic $74,399 |
| Immigrants | Somalia | 0.1 /100 | #286 | Tragic $74,300 |
| Iroquois | 0.1 /100 | #287 | Tragic $74,279 |