Luxembourger vs German Median Household Income
COMPARE
Luxembourger
German
Median Household Income
Median Household Income Comparison
Luxembourgers
Germans
$86,418
MEDIAN HOUSEHOLD INCOME
70.0/ 100
METRIC RATING
160th/ 347
METRIC RANK
$83,358
MEDIAN HOUSEHOLD INCOME
24.6/ 100
METRIC RATING
199th/ 347
METRIC RANK
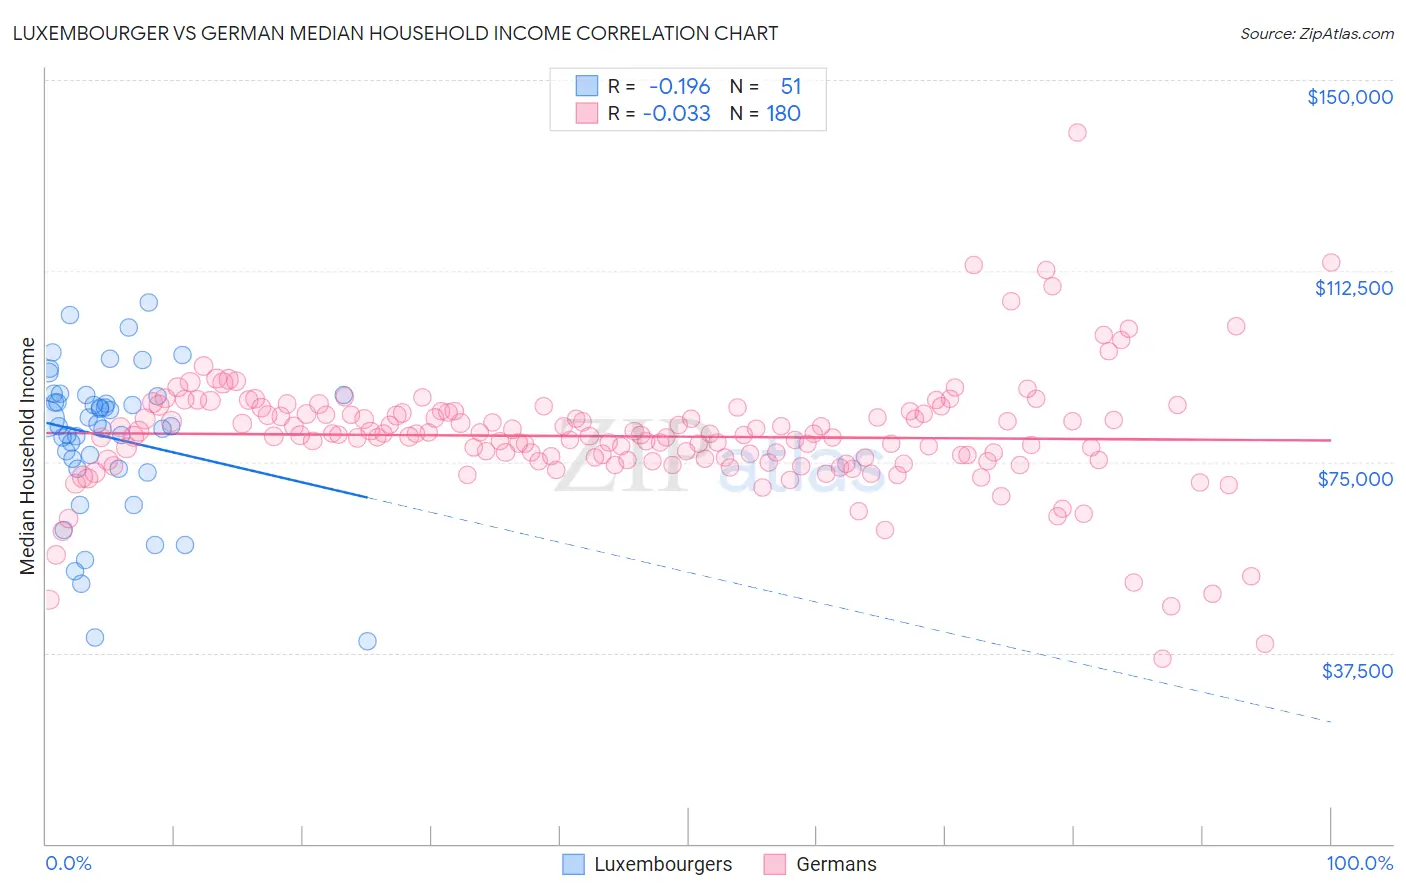
Luxembourger vs German Median Household Income Correlation Chart
The statistical analysis conducted on geographies consisting of 144,630,176 people shows a poor negative correlation between the proportion of Luxembourgers and median household income in the United States with a correlation coefficient (R) of -0.196 and weighted average of $86,418. Similarly, the statistical analysis conducted on geographies consisting of 579,647,874 people shows no correlation between the proportion of Germans and median household income in the United States with a correlation coefficient (R) of -0.033 and weighted average of $83,358, a difference of 3.7%.
Median Household Income Correlation Summary
| Measurement | Luxembourger | German |
| Minimum | $39,750 | $36,331 |
| Maximum | $106,423 | $139,709 |
| Range | $66,673 | $103,378 |
| Mean | $79,856 | $80,014 |
| Median | $82,566 | $80,167 |
| Interquartile 25% (IQ1) | $73,750 | $75,354 |
| Interquartile 75% (IQ3) | $88,077 | $84,522 |
| Interquartile Range (IQR) | $14,327 | $9,168 |
| Standard Deviation (Sample) | $14,707 | $11,898 |
| Standard Deviation (Population) | $14,562 | $11,865 |
Similar Demographics by Median Household Income
Demographics Similar to Luxembourgers by Median Household Income
In terms of median household income, the demographic groups most similar to Luxembourgers are Immigrants from Uzbekistan ($86,425, a difference of 0.010%), Slavic ($86,398, a difference of 0.020%), Moroccan ($86,468, a difference of 0.060%), Samoan ($86,498, a difference of 0.090%), and Immigrants from Albania ($86,534, a difference of 0.13%).
| Demographics | Rating | Rank | Median Household Income |
| South Americans | 75.1 /100 | #153 | Good $86,824 |
| Immigrants | Germany | 74.4 /100 | #154 | Good $86,764 |
| Carpatho Rusyns | 72.8 /100 | #155 | Good $86,635 |
| Immigrants | Albania | 71.5 /100 | #156 | Good $86,534 |
| Samoans | 71.0 /100 | #157 | Good $86,498 |
| Moroccans | 70.6 /100 | #158 | Good $86,468 |
| Immigrants | Uzbekistan | 70.1 /100 | #159 | Good $86,425 |
| Luxembourgers | 70.0 /100 | #160 | Good $86,418 |
| Slavs | 69.7 /100 | #161 | Good $86,398 |
| Guamanians/Chamorros | 67.7 /100 | #162 | Good $86,255 |
| Czechs | 66.4 /100 | #163 | Good $86,164 |
| Irish | 66.2 /100 | #164 | Good $86,145 |
| Norwegians | 65.3 /100 | #165 | Good $86,084 |
| Scandinavians | 65.1 /100 | #166 | Good $86,073 |
| Immigrants | Immigrants | 61.3 /100 | #167 | Good $85,818 |
Demographics Similar to Germans by Median Household Income
In terms of median household income, the demographic groups most similar to Germans are Tsimshian ($83,346, a difference of 0.010%), Spanish ($83,343, a difference of 0.020%), Japanese ($83,395, a difference of 0.040%), Immigrants from Thailand ($83,327, a difference of 0.040%), and Immigrants from Cambodia ($83,304, a difference of 0.070%).
| Demographics | Rating | Rank | Median Household Income |
| Welsh | 28.0 /100 | #192 | Fair $83,628 |
| Finns | 27.7 /100 | #193 | Fair $83,607 |
| Ghanaians | 27.4 /100 | #194 | Fair $83,582 |
| Immigrants | Armenia | 27.0 /100 | #195 | Fair $83,555 |
| French | 26.0 /100 | #196 | Fair $83,468 |
| Aleuts | 25.7 /100 | #197 | Fair $83,446 |
| Japanese | 25.1 /100 | #198 | Fair $83,395 |
| Germans | 24.6 /100 | #199 | Fair $83,358 |
| Tsimshian | 24.5 /100 | #200 | Fair $83,346 |
| Spanish | 24.4 /100 | #201 | Fair $83,343 |
| Immigrants | Thailand | 24.3 /100 | #202 | Fair $83,327 |
| Immigrants | Cambodia | 24.0 /100 | #203 | Fair $83,304 |
| Immigrants | Africa | 23.8 /100 | #204 | Fair $83,289 |
| Celtics | 22.7 /100 | #205 | Fair $83,193 |
| Immigrants | Kenya | 21.3 /100 | #206 | Fair $83,068 |