Cuban vs Immigrants from Netherlands 2nd Grade
COMPARE
Cuban
Immigrants from Netherlands
2nd Grade
2nd Grade Comparison
Cubans
Immigrants from Netherlands
97.4%
2ND GRADE
0.3/ 100
METRIC RATING
267th/ 347
METRIC RANK
98.3%
2ND GRADE
99.4/ 100
METRIC RATING
74th/ 347
METRIC RANK
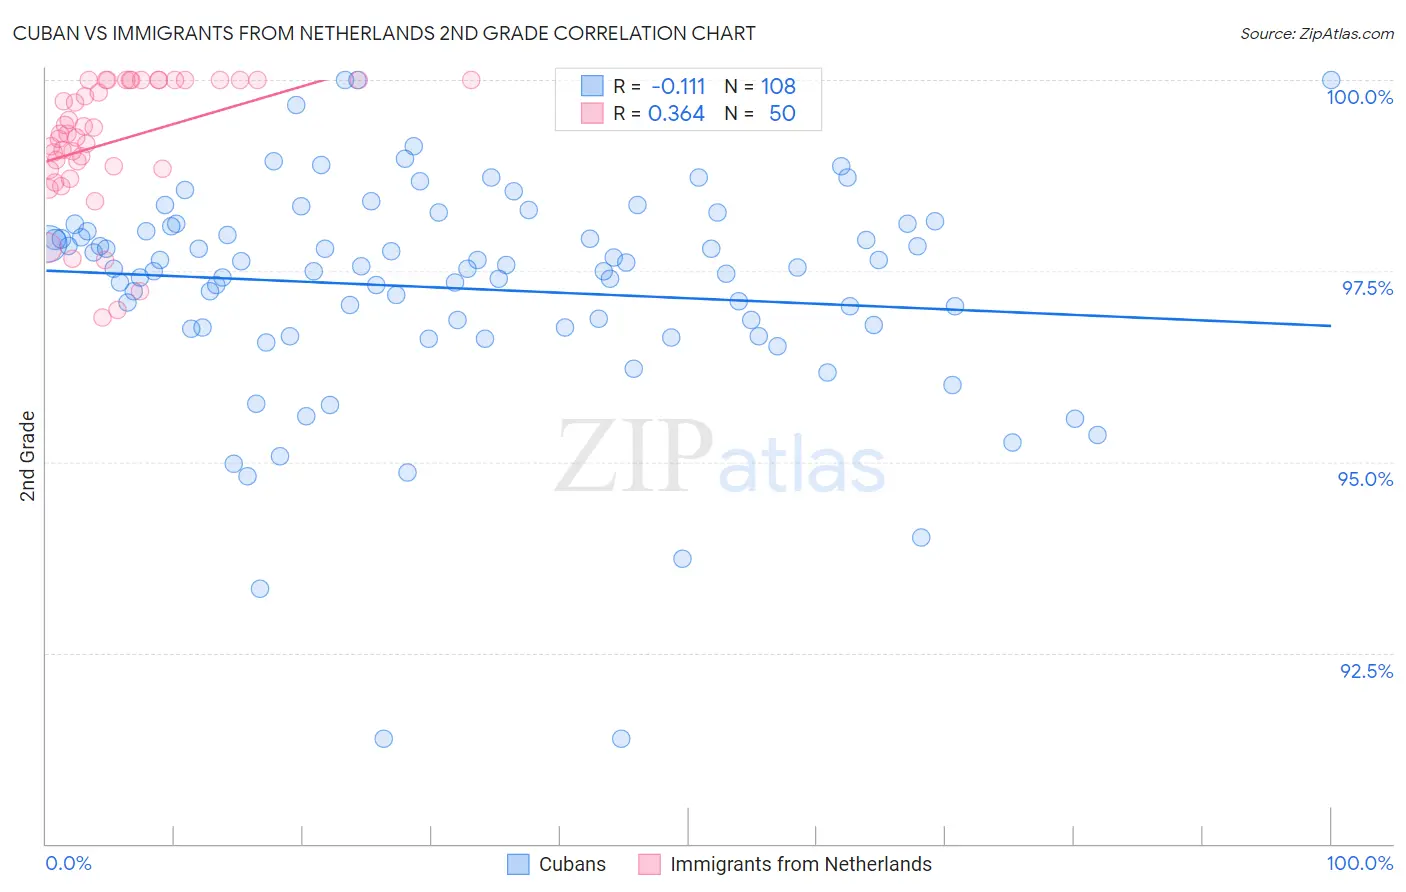
Cuban vs Immigrants from Netherlands 2nd Grade Correlation Chart
The statistical analysis conducted on geographies consisting of 449,326,865 people shows a poor negative correlation between the proportion of Cubans and percentage of population with at least 2nd grade education in the United States with a correlation coefficient (R) of -0.111 and weighted average of 97.4%. Similarly, the statistical analysis conducted on geographies consisting of 237,869,934 people shows a mild positive correlation between the proportion of Immigrants from Netherlands and percentage of population with at least 2nd grade education in the United States with a correlation coefficient (R) of 0.364 and weighted average of 98.3%, a difference of 0.87%.
2nd Grade Correlation Summary
| Measurement | Cuban | Immigrants from Netherlands |
| Minimum | 91.4% | 96.9% |
| Maximum | 100.0% | 100.0% |
| Range | 8.6% | 3.1% |
| Mean | 97.3% | 99.2% |
| Median | 97.5% | 99.3% |
| Interquartile 25% (IQ1) | 96.8% | 98.8% |
| Interquartile 75% (IQ3) | 98.0% | 100.0% |
| Interquartile Range (IQR) | 1.3% | 1.2% |
| Standard Deviation (Sample) | 1.5% | 0.85% |
| Standard Deviation (Population) | 1.5% | 0.84% |
Similar Demographics by 2nd Grade
Demographics Similar to Cubans by 2nd Grade
In terms of 2nd grade, the demographic groups most similar to Cubans are Immigrants from Nigeria (97.4%, a difference of 0.0%), West Indian (97.4%, a difference of 0.010%), Taiwanese (97.4%, a difference of 0.020%), Immigrants from Ethiopia (97.4%, a difference of 0.020%), and Immigrants from Liberia (97.4%, a difference of 0.020%).
| Demographics | Rating | Rank | 2nd Grade |
| Assyrians/Chaldeans/Syriacs | 0.5 /100 | #260 | Tragic 97.5% |
| Armenians | 0.5 /100 | #261 | Tragic 97.5% |
| Taiwanese | 0.4 /100 | #262 | Tragic 97.4% |
| Immigrants | Ethiopia | 0.4 /100 | #263 | Tragic 97.4% |
| Immigrants | Liberia | 0.4 /100 | #264 | Tragic 97.4% |
| Immigrants | South America | 0.4 /100 | #265 | Tragic 97.4% |
| Immigrants | Sierra Leone | 0.4 /100 | #266 | Tragic 97.4% |
| Cubans | 0.3 /100 | #267 | Tragic 97.4% |
| Immigrants | Nigeria | 0.3 /100 | #268 | Tragic 97.4% |
| West Indians | 0.3 /100 | #269 | Tragic 97.4% |
| Immigrants | Jamaica | 0.2 /100 | #270 | Tragic 97.4% |
| Immigrants | Cameroon | 0.2 /100 | #271 | Tragic 97.4% |
| Immigrants | Peru | 0.1 /100 | #272 | Tragic 97.4% |
| Immigrants | Bolivia | 0.1 /100 | #273 | Tragic 97.4% |
| Ghanaians | 0.1 /100 | #274 | Tragic 97.4% |
Demographics Similar to Immigrants from Netherlands by 2nd Grade
In terms of 2nd grade, the demographic groups most similar to Immigrants from Netherlands are Shoshone (98.3%, a difference of 0.010%), Cherokee (98.3%, a difference of 0.010%), Immigrants from England (98.3%, a difference of 0.010%), Cheyenne (98.3%, a difference of 0.020%), and Cajun (98.3%, a difference of 0.020%).
| Demographics | Rating | Rank | 2nd Grade |
| Immigrants | Northern Europe | 99.7 /100 | #67 | Exceptional 98.3% |
| Russians | 99.7 /100 | #68 | Exceptional 98.3% |
| Immigrants | Austria | 99.6 /100 | #69 | Exceptional 98.3% |
| Serbians | 99.6 /100 | #70 | Exceptional 98.3% |
| Chickasaw | 99.6 /100 | #71 | Exceptional 98.3% |
| Cheyenne | 99.6 /100 | #72 | Exceptional 98.3% |
| Cajuns | 99.5 /100 | #73 | Exceptional 98.3% |
| Immigrants | Netherlands | 99.4 /100 | #74 | Exceptional 98.3% |
| Shoshone | 99.4 /100 | #75 | Exceptional 98.3% |
| Cherokee | 99.4 /100 | #76 | Exceptional 98.3% |
| Immigrants | England | 99.4 /100 | #77 | Exceptional 98.3% |
| Immigrants | Lithuania | 99.3 /100 | #78 | Exceptional 98.2% |
| Immigrants | Belgium | 99.3 /100 | #79 | Exceptional 98.2% |
| Osage | 99.2 /100 | #80 | Exceptional 98.2% |
| Icelanders | 99.2 /100 | #81 | Exceptional 98.2% |