Cuban vs Ottawa Median Earnings
COMPARE
Cuban
Ottawa
Median Earnings
Median Earnings Comparison
Cubans
Ottawa
$40,619
MEDIAN EARNINGS
0.0/ 100
METRIC RATING
308th/ 347
METRIC RANK
$39,721
MEDIAN EARNINGS
0.0/ 100
METRIC RATING
324th/ 347
METRIC RANK
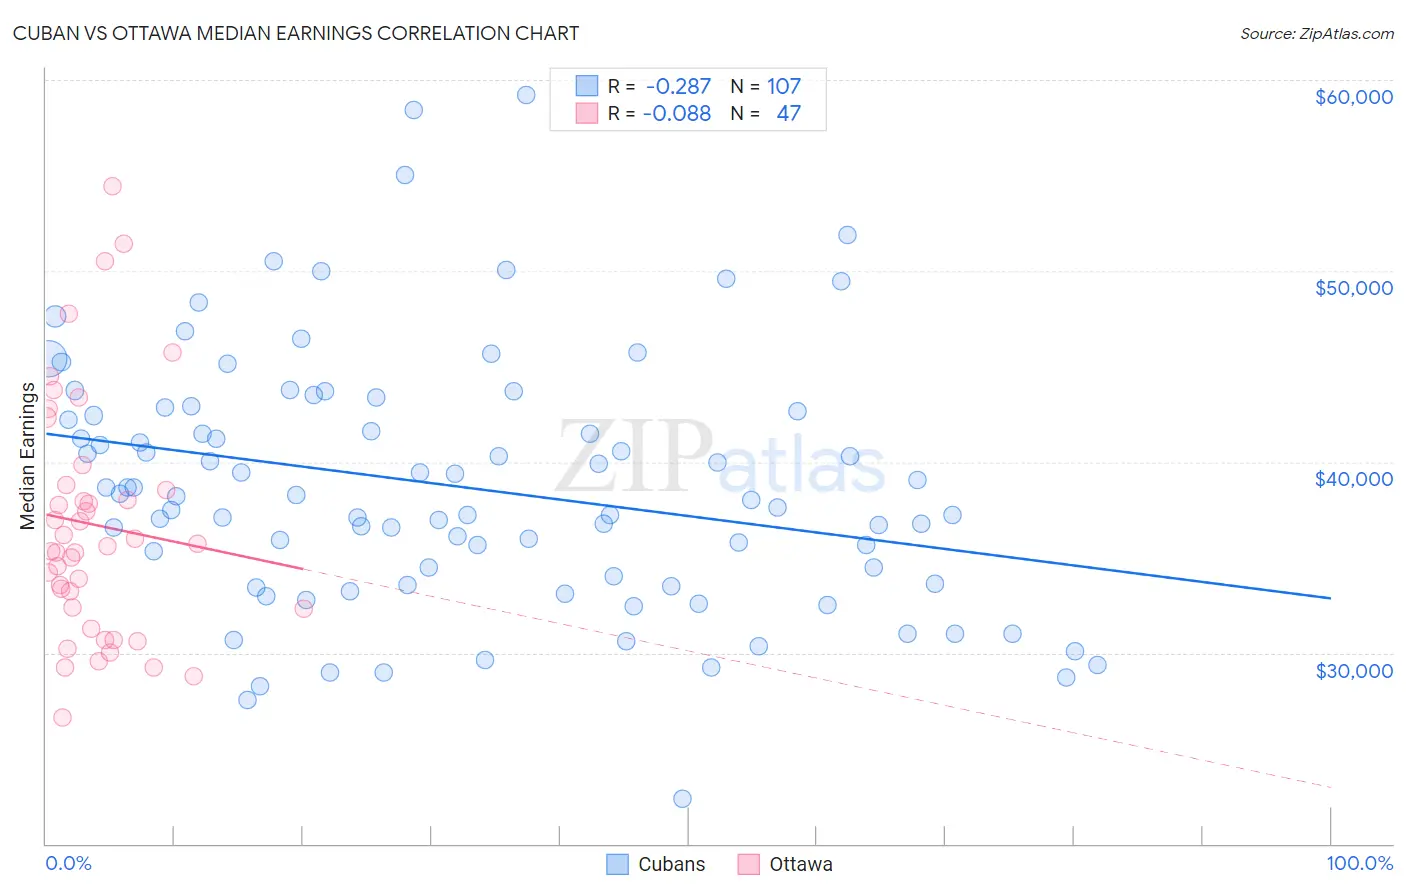
Cuban vs Ottawa Median Earnings Correlation Chart
The statistical analysis conducted on geographies consisting of 449,351,529 people shows a weak negative correlation between the proportion of Cubans and median earnings in the United States with a correlation coefficient (R) of -0.287 and weighted average of $40,619. Similarly, the statistical analysis conducted on geographies consisting of 49,956,035 people shows a slight negative correlation between the proportion of Ottawa and median earnings in the United States with a correlation coefficient (R) of -0.088 and weighted average of $39,721, a difference of 2.3%.
Median Earnings Correlation Summary
| Measurement | Cuban | Ottawa |
| Minimum | $22,371 | $26,644 |
| Maximum | $59,236 | $54,444 |
| Range | $36,865 | $27,800 |
| Mean | $38,708 | $36,701 |
| Median | $38,230 | $35,608 |
| Interquartile 25% (IQ1) | $33,586 | $32,292 |
| Interquartile 75% (IQ3) | $42,663 | $38,794 |
| Interquartile Range (IQR) | $9,077 | $6,502 |
| Standard Deviation (Sample) | $6,670 | $6,309 |
| Standard Deviation (Population) | $6,639 | $6,241 |
Demographics Similar to Cubans and Ottawa by Median Earnings
In terms of median earnings, the demographic groups most similar to Cubans are Honduran ($40,638, a difference of 0.050%), Yaqui ($40,647, a difference of 0.070%), Immigrants from Haiti ($40,550, a difference of 0.17%), Apache ($40,388, a difference of 0.57%), and Hispanic or Latino ($40,288, a difference of 0.82%). Similarly, the demographic groups most similar to Ottawa are Bahamian ($39,735, a difference of 0.040%), Immigrants from Central America ($39,762, a difference of 0.10%), Creek ($39,648, a difference of 0.18%), Mexican ($39,834, a difference of 0.29%), and Immigrants from Bahamas ($39,861, a difference of 0.35%).
| Demographics | Rating | Rank | Median Earnings |
| Yaqui | 0.0 /100 | #306 | Tragic $40,647 |
| Hondurans | 0.0 /100 | #307 | Tragic $40,638 |
| Cubans | 0.0 /100 | #308 | Tragic $40,619 |
| Immigrants | Haiti | 0.0 /100 | #309 | Tragic $40,550 |
| Apache | 0.0 /100 | #310 | Tragic $40,388 |
| Hispanics or Latinos | 0.0 /100 | #311 | Tragic $40,288 |
| Chippewa | 0.0 /100 | #312 | Tragic $40,287 |
| Choctaw | 0.0 /100 | #313 | Tragic $40,270 |
| Cheyenne | 0.0 /100 | #314 | Tragic $40,233 |
| Seminole | 0.0 /100 | #315 | Tragic $40,233 |
| Immigrants | Honduras | 0.0 /100 | #316 | Tragic $40,195 |
| Fijians | 0.0 /100 | #317 | Tragic $40,193 |
| Dutch West Indians | 0.0 /100 | #318 | Tragic $40,107 |
| Blacks/African Americans | 0.0 /100 | #319 | Tragic $40,085 |
| Immigrants | Bahamas | 0.0 /100 | #320 | Tragic $39,861 |
| Mexicans | 0.0 /100 | #321 | Tragic $39,834 |
| Immigrants | Central America | 0.0 /100 | #322 | Tragic $39,762 |
| Bahamians | 0.0 /100 | #323 | Tragic $39,735 |
| Ottawa | 0.0 /100 | #324 | Tragic $39,721 |
| Creek | 0.0 /100 | #325 | Tragic $39,648 |
| Immigrants | Yemen | 0.0 /100 | #326 | Tragic $39,540 |