Cuban vs Immigrants from India Median Earnings
COMPARE
Cuban
Immigrants from India
Median Earnings
Median Earnings Comparison
Cubans
Immigrants from India
$40,619
MEDIAN EARNINGS
0.0/ 100
METRIC RATING
308th/ 347
METRIC RANK
$60,648
MEDIAN EARNINGS
100.0/ 100
METRIC RATING
3rd/ 347
METRIC RANK
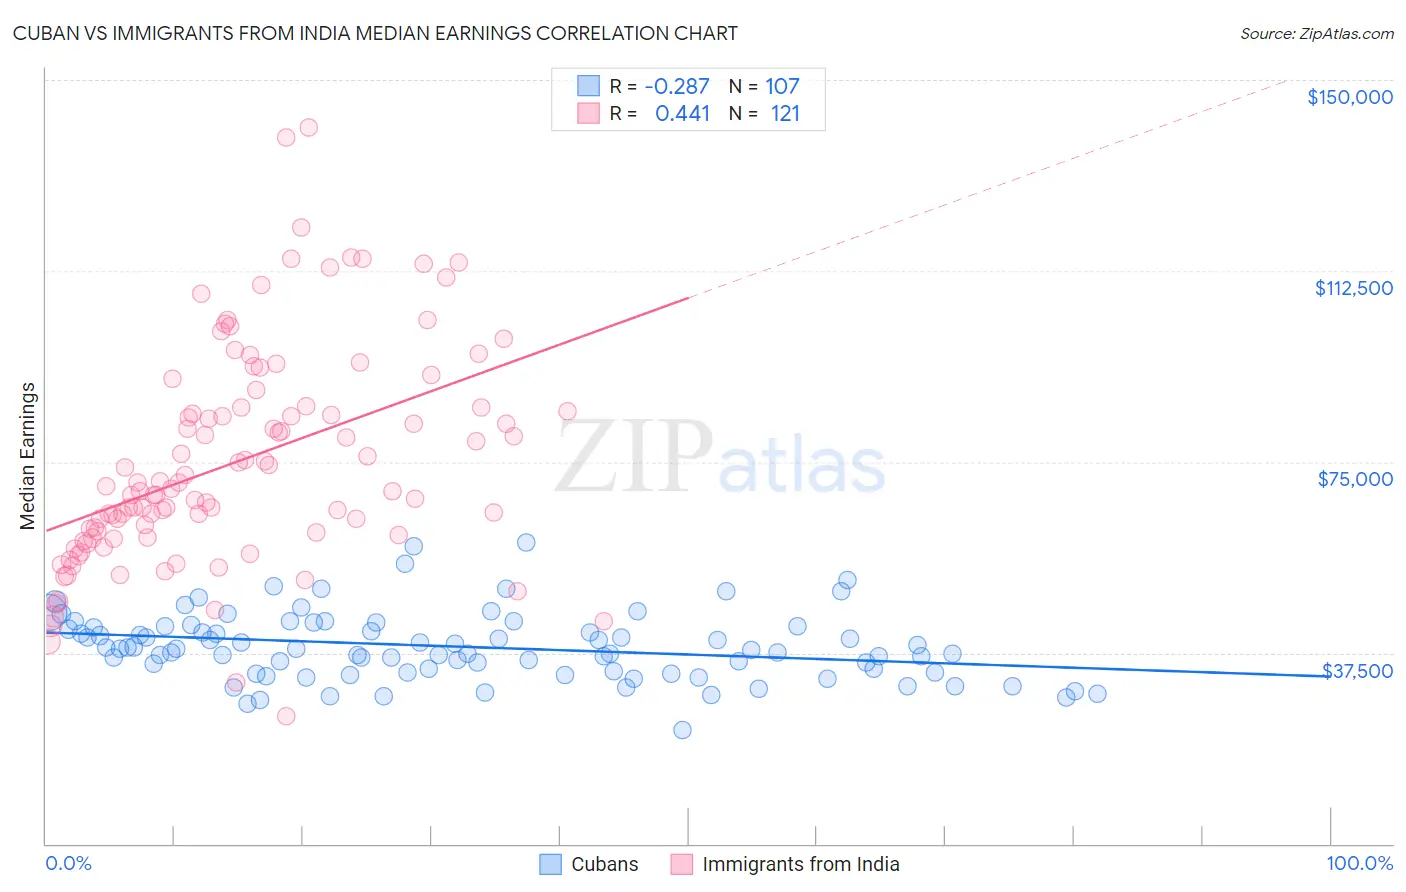
Cuban vs Immigrants from India Median Earnings Correlation Chart
The statistical analysis conducted on geographies consisting of 449,351,529 people shows a weak negative correlation between the proportion of Cubans and median earnings in the United States with a correlation coefficient (R) of -0.287 and weighted average of $40,619. Similarly, the statistical analysis conducted on geographies consisting of 434,105,381 people shows a moderate positive correlation between the proportion of Immigrants from India and median earnings in the United States with a correlation coefficient (R) of 0.441 and weighted average of $60,648, a difference of 49.3%.
Median Earnings Correlation Summary
| Measurement | Cuban | Immigrants from India |
| Minimum | $22,371 | $24,957 |
| Maximum | $59,236 | $140,742 |
| Range | $36,865 | $115,785 |
| Mean | $38,708 | $74,941 |
| Median | $38,230 | $69,769 |
| Interquartile 25% (IQ1) | $33,586 | $60,363 |
| Interquartile 75% (IQ3) | $42,663 | $85,753 |
| Interquartile Range (IQR) | $9,077 | $25,390 |
| Standard Deviation (Sample) | $6,670 | $21,309 |
| Standard Deviation (Population) | $6,639 | $21,220 |
Similar Demographics by Median Earnings
Demographics Similar to Cubans by Median Earnings
In terms of median earnings, the demographic groups most similar to Cubans are Honduran ($40,638, a difference of 0.050%), Yaqui ($40,647, a difference of 0.070%), Chickasaw ($40,672, a difference of 0.13%), Immigrants from Haiti ($40,550, a difference of 0.17%), and Immigrants from Guatemala ($40,851, a difference of 0.57%).
| Demographics | Rating | Rank | Median Earnings |
| Immigrants | Latin America | 0.1 /100 | #301 | Tragic $41,049 |
| Shoshone | 0.0 /100 | #302 | Tragic $40,932 |
| Haitians | 0.0 /100 | #303 | Tragic $40,918 |
| Immigrants | Guatemala | 0.0 /100 | #304 | Tragic $40,851 |
| Chickasaw | 0.0 /100 | #305 | Tragic $40,672 |
| Yaqui | 0.0 /100 | #306 | Tragic $40,647 |
| Hondurans | 0.0 /100 | #307 | Tragic $40,638 |
| Cubans | 0.0 /100 | #308 | Tragic $40,619 |
| Immigrants | Haiti | 0.0 /100 | #309 | Tragic $40,550 |
| Apache | 0.0 /100 | #310 | Tragic $40,388 |
| Hispanics or Latinos | 0.0 /100 | #311 | Tragic $40,288 |
| Chippewa | 0.0 /100 | #312 | Tragic $40,287 |
| Choctaw | 0.0 /100 | #313 | Tragic $40,270 |
| Cheyenne | 0.0 /100 | #314 | Tragic $40,233 |
| Seminole | 0.0 /100 | #315 | Tragic $40,233 |
Demographics Similar to Immigrants from India by Median Earnings
In terms of median earnings, the demographic groups most similar to Immigrants from India are Immigrants from Taiwan ($61,151, a difference of 0.83%), Filipino ($61,197, a difference of 0.91%), Immigrants from Hong Kong ($59,433, a difference of 2.0%), Thai ($59,237, a difference of 2.4%), and Immigrants from Singapore ($59,038, a difference of 2.7%).
| Demographics | Rating | Rank | Median Earnings |
| Filipinos | 100.0 /100 | #1 | Exceptional $61,197 |
| Immigrants | Taiwan | 100.0 /100 | #2 | Exceptional $61,151 |
| Immigrants | India | 100.0 /100 | #3 | Exceptional $60,648 |
| Immigrants | Hong Kong | 100.0 /100 | #4 | Exceptional $59,433 |
| Thais | 100.0 /100 | #5 | Exceptional $59,237 |
| Immigrants | Singapore | 100.0 /100 | #6 | Exceptional $59,038 |
| Iranians | 100.0 /100 | #7 | Exceptional $58,474 |
| Immigrants | Iran | 100.0 /100 | #8 | Exceptional $57,612 |
| Okinawans | 100.0 /100 | #9 | Exceptional $57,550 |
| Immigrants | South Central Asia | 100.0 /100 | #10 | Exceptional $57,114 |
| Immigrants | Israel | 100.0 /100 | #11 | Exceptional $57,034 |
| Immigrants | Ireland | 100.0 /100 | #12 | Exceptional $56,854 |
| Immigrants | China | 100.0 /100 | #13 | Exceptional $56,638 |
| Immigrants | Australia | 100.0 /100 | #14 | Exceptional $56,305 |
| Indians (Asian) | 100.0 /100 | #15 | Exceptional $56,253 |