Cuban vs Haitian Median Earnings
COMPARE
Cuban
Haitian
Median Earnings
Median Earnings Comparison
Cubans
Haitians
$40,619
MEDIAN EARNINGS
0.0/ 100
METRIC RATING
308th/ 347
METRIC RANK
$40,918
MEDIAN EARNINGS
0.0/ 100
METRIC RATING
303rd/ 347
METRIC RANK
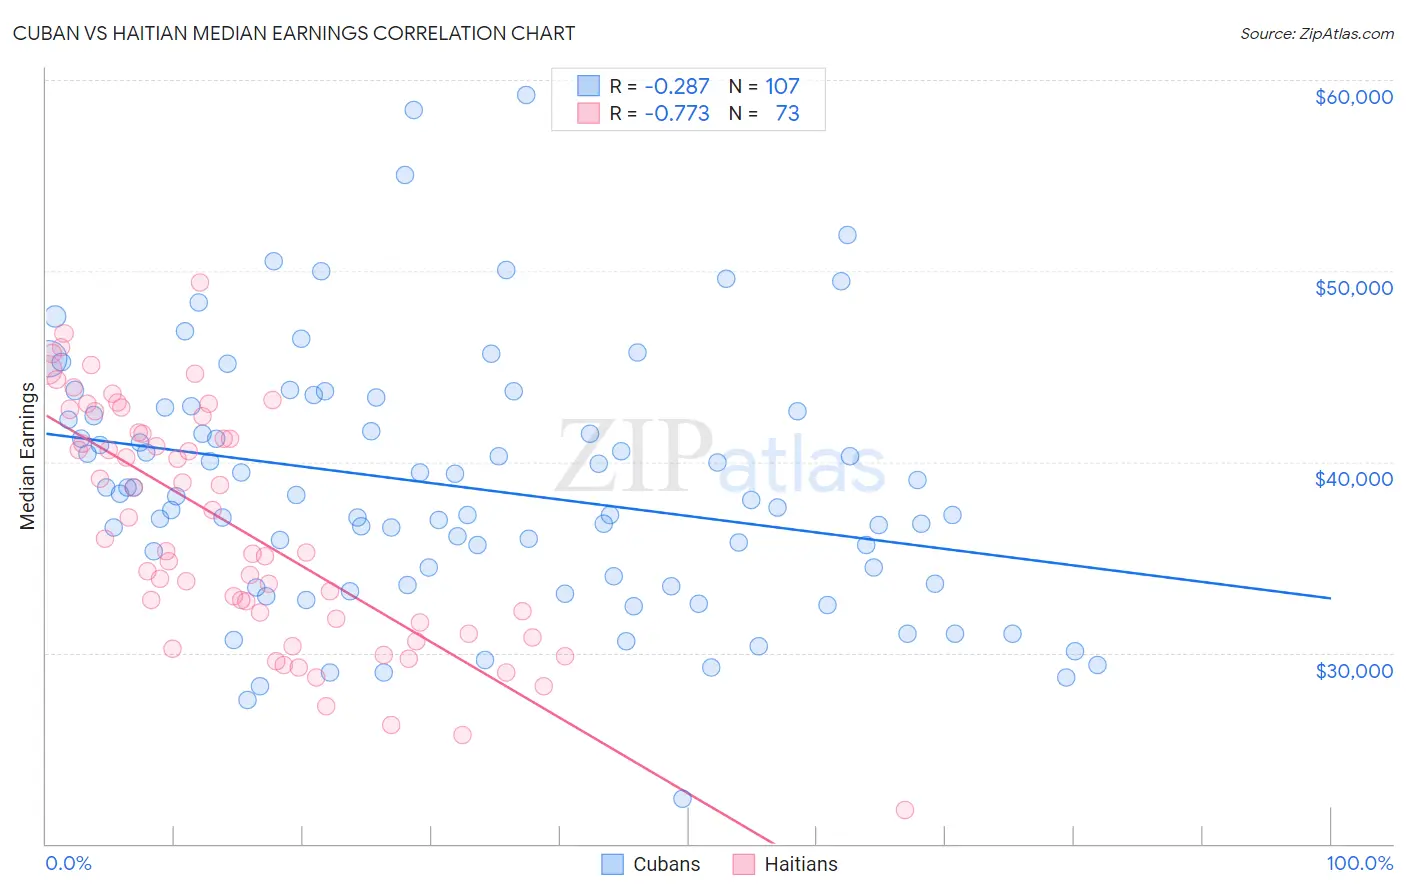
Cuban vs Haitian Median Earnings Correlation Chart
The statistical analysis conducted on geographies consisting of 449,351,529 people shows a weak negative correlation between the proportion of Cubans and median earnings in the United States with a correlation coefficient (R) of -0.287 and weighted average of $40,619. Similarly, the statistical analysis conducted on geographies consisting of 288,009,020 people shows a strong negative correlation between the proportion of Haitians and median earnings in the United States with a correlation coefficient (R) of -0.773 and weighted average of $40,918, a difference of 0.74%.
Median Earnings Correlation Summary
| Measurement | Cuban | Haitian |
| Minimum | $22,371 | $21,741 |
| Maximum | $59,236 | $49,370 |
| Range | $36,865 | $27,629 |
| Mean | $38,708 | $36,539 |
| Median | $38,230 | $35,319 |
| Interquartile 25% (IQ1) | $33,586 | $31,314 |
| Interquartile 75% (IQ3) | $42,663 | $41,959 |
| Interquartile Range (IQR) | $9,077 | $10,645 |
| Standard Deviation (Sample) | $6,670 | $6,179 |
| Standard Deviation (Population) | $6,639 | $6,136 |
Demographics Similar to Cubans and Haitians by Median Earnings
In terms of median earnings, the demographic groups most similar to Cubans are Honduran ($40,638, a difference of 0.050%), Yaqui ($40,647, a difference of 0.070%), Chickasaw ($40,672, a difference of 0.13%), Immigrants from Haiti ($40,550, a difference of 0.17%), and Immigrants from Guatemala ($40,851, a difference of 0.57%). Similarly, the demographic groups most similar to Haitians are Shoshone ($40,932, a difference of 0.030%), Immigrants from Guatemala ($40,851, a difference of 0.16%), Ute ($41,051, a difference of 0.32%), Immigrants from Latin America ($41,049, a difference of 0.32%), and Immigrants from Caribbean ($41,119, a difference of 0.49%).
| Demographics | Rating | Rank | Median Earnings |
| Bangladeshis | 0.1 /100 | #295 | Tragic $41,263 |
| Cherokee | 0.1 /100 | #296 | Tragic $41,252 |
| Guatemalans | 0.1 /100 | #297 | Tragic $41,205 |
| Immigrants | Micronesia | 0.1 /100 | #298 | Tragic $41,133 |
| Immigrants | Caribbean | 0.1 /100 | #299 | Tragic $41,119 |
| Ute | 0.1 /100 | #300 | Tragic $41,051 |
| Immigrants | Latin America | 0.1 /100 | #301 | Tragic $41,049 |
| Shoshone | 0.0 /100 | #302 | Tragic $40,932 |
| Haitians | 0.0 /100 | #303 | Tragic $40,918 |
| Immigrants | Guatemala | 0.0 /100 | #304 | Tragic $40,851 |
| Chickasaw | 0.0 /100 | #305 | Tragic $40,672 |
| Yaqui | 0.0 /100 | #306 | Tragic $40,647 |
| Hondurans | 0.0 /100 | #307 | Tragic $40,638 |
| Cubans | 0.0 /100 | #308 | Tragic $40,619 |
| Immigrants | Haiti | 0.0 /100 | #309 | Tragic $40,550 |
| Apache | 0.0 /100 | #310 | Tragic $40,388 |
| Hispanics or Latinos | 0.0 /100 | #311 | Tragic $40,288 |
| Chippewa | 0.0 /100 | #312 | Tragic $40,287 |
| Choctaw | 0.0 /100 | #313 | Tragic $40,270 |
| Cheyenne | 0.0 /100 | #314 | Tragic $40,233 |
| Seminole | 0.0 /100 | #315 | Tragic $40,233 |