Mongolian vs Lithuanian Median Male Earnings
COMPARE
Mongolian
Lithuanian
Median Male Earnings
Median Male Earnings Comparison
Mongolians
Lithuanians
$60,350
MEDIAN MALE EARNINGS
99.7/ 100
METRIC RATING
71st/ 347
METRIC RANK
$61,228
MEDIAN MALE EARNINGS
99.9/ 100
METRIC RATING
56th/ 347
METRIC RANK
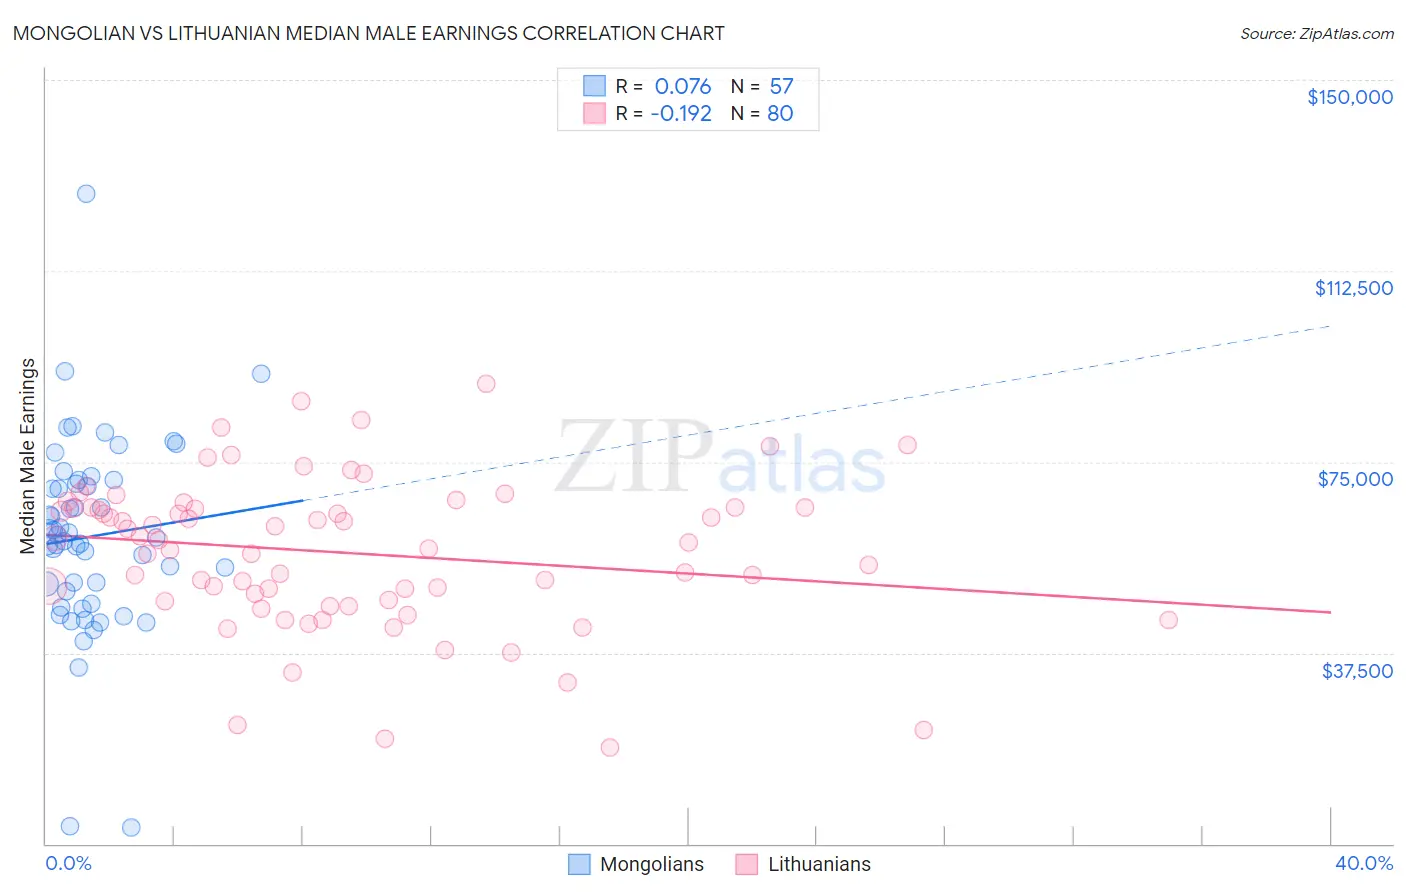
Mongolian vs Lithuanian Median Male Earnings Correlation Chart
The statistical analysis conducted on geographies consisting of 140,336,104 people shows a slight positive correlation between the proportion of Mongolians and median male earnings in the United States with a correlation coefficient (R) of 0.076 and weighted average of $60,350. Similarly, the statistical analysis conducted on geographies consisting of 421,749,133 people shows a poor negative correlation between the proportion of Lithuanians and median male earnings in the United States with a correlation coefficient (R) of -0.192 and weighted average of $61,228, a difference of 1.5%.
Median Male Earnings Correlation Summary
| Measurement | Mongolian | Lithuanian |
| Minimum | $3,109 | $18,839 |
| Maximum | $127,545 | $90,313 |
| Range | $124,436 | $71,474 |
| Mean | $60,323 | $57,160 |
| Median | $60,102 | $59,359 |
| Interquartile 25% (IQ1) | $48,308 | $47,714 |
| Interquartile 75% (IQ3) | $71,104 | $66,000 |
| Interquartile Range (IQR) | $22,796 | $18,286 |
| Standard Deviation (Sample) | $19,294 | $14,769 |
| Standard Deviation (Population) | $19,124 | $14,676 |
Demographics Similar to Mongolians and Lithuanians by Median Male Earnings
In terms of median male earnings, the demographic groups most similar to Mongolians are Immigrants from Bulgaria ($60,358, a difference of 0.010%), Immigrants from Western Europe ($60,334, a difference of 0.030%), Immigrants from Canada ($60,388, a difference of 0.060%), Immigrants from North America ($60,265, a difference of 0.14%), and Immigrants from Serbia ($60,600, a difference of 0.41%). Similarly, the demographic groups most similar to Lithuanians are Immigrants from Scotland ($61,220, a difference of 0.010%), Greek ($61,242, a difference of 0.020%), New Zealander ($61,199, a difference of 0.050%), Immigrants from Netherlands ($61,096, a difference of 0.22%), and Egyptian ($61,095, a difference of 0.22%).
| Demographics | Rating | Rank | Median Male Earnings |
| South Africans | 99.9 /100 | #53 | Exceptional $61,460 |
| Immigrants | Latvia | 99.9 /100 | #54 | Exceptional $61,422 |
| Greeks | 99.9 /100 | #55 | Exceptional $61,242 |
| Lithuanians | 99.9 /100 | #56 | Exceptional $61,228 |
| Immigrants | Scotland | 99.9 /100 | #57 | Exceptional $61,220 |
| New Zealanders | 99.9 /100 | #58 | Exceptional $61,199 |
| Immigrants | Netherlands | 99.8 /100 | #59 | Exceptional $61,096 |
| Egyptians | 99.8 /100 | #60 | Exceptional $61,095 |
| Bolivians | 99.8 /100 | #61 | Exceptional $61,066 |
| Immigrants | Romania | 99.8 /100 | #62 | Exceptional $61,040 |
| Immigrants | Pakistan | 99.8 /100 | #63 | Exceptional $60,987 |
| Immigrants | Eastern Europe | 99.8 /100 | #64 | Exceptional $60,958 |
| Immigrants | Indonesia | 99.8 /100 | #65 | Exceptional $60,935 |
| Immigrants | Croatia | 99.8 /100 | #66 | Exceptional $60,914 |
| Immigrants | Spain | 99.8 /100 | #67 | Exceptional $60,750 |
| Immigrants | Serbia | 99.7 /100 | #68 | Exceptional $60,600 |
| Immigrants | Canada | 99.7 /100 | #69 | Exceptional $60,388 |
| Immigrants | Bulgaria | 99.7 /100 | #70 | Exceptional $60,358 |
| Mongolians | 99.7 /100 | #71 | Exceptional $60,350 |
| Immigrants | Western Europe | 99.7 /100 | #72 | Exceptional $60,334 |
| Immigrants | North America | 99.7 /100 | #73 | Exceptional $60,265 |