Immigrants from St. Vincent and the Grenadines vs Lithuanian Median Male Earnings
COMPARE
Immigrants from St. Vincent and the Grenadines
Lithuanian
Median Male Earnings
Median Male Earnings Comparison
Immigrants from St. Vincent and the Grenadines
Lithuanians
$50,665
MEDIAN MALE EARNINGS
2.3/ 100
METRIC RATING
241st/ 347
METRIC RANK
$61,228
MEDIAN MALE EARNINGS
99.9/ 100
METRIC RATING
56th/ 347
METRIC RANK
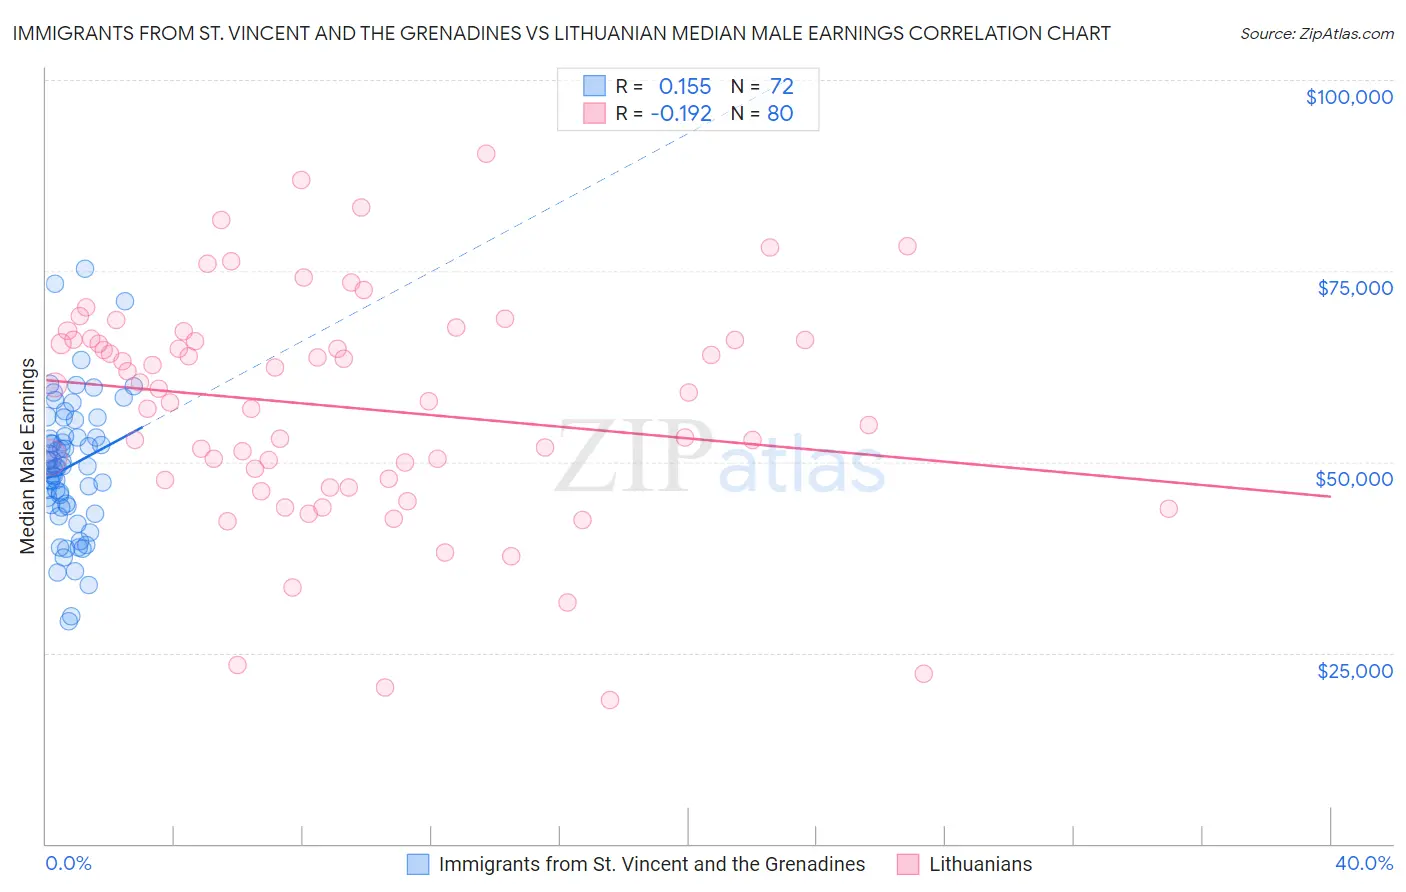
Immigrants from St. Vincent and the Grenadines vs Lithuanian Median Male Earnings Correlation Chart
The statistical analysis conducted on geographies consisting of 56,194,300 people shows a poor positive correlation between the proportion of Immigrants from St. Vincent and the Grenadines and median male earnings in the United States with a correlation coefficient (R) of 0.155 and weighted average of $50,665. Similarly, the statistical analysis conducted on geographies consisting of 421,749,133 people shows a poor negative correlation between the proportion of Lithuanians and median male earnings in the United States with a correlation coefficient (R) of -0.192 and weighted average of $61,228, a difference of 20.8%.
Median Male Earnings Correlation Summary
| Measurement | Immigrants from St. Vincent and the Grenadines | Lithuanian |
| Minimum | $29,197 | $18,839 |
| Maximum | $75,304 | $90,313 |
| Range | $46,107 | $71,474 |
| Mean | $49,395 | $57,160 |
| Median | $49,325 | $59,359 |
| Interquartile 25% (IQ1) | $44,224 | $47,714 |
| Interquartile 75% (IQ3) | $53,330 | $66,000 |
| Interquartile Range (IQR) | $9,107 | $18,286 |
| Standard Deviation (Sample) | $8,903 | $14,769 |
| Standard Deviation (Population) | $8,841 | $14,676 |
Similar Demographics by Median Male Earnings
Demographics Similar to Immigrants from St. Vincent and the Grenadines by Median Male Earnings
In terms of median male earnings, the demographic groups most similar to Immigrants from St. Vincent and the Grenadines are West Indian ($50,682, a difference of 0.030%), Guyanese ($50,613, a difference of 0.10%), French American Indian ($50,611, a difference of 0.11%), American ($50,761, a difference of 0.19%), and Malaysian ($50,772, a difference of 0.21%).
| Demographics | Rating | Rank | Median Male Earnings |
| Cape Verdeans | 3.5 /100 | #234 | Tragic $51,103 |
| Immigrants | Western Africa | 3.0 /100 | #235 | Tragic $50,940 |
| Pennsylvania Germans | 2.8 /100 | #236 | Tragic $50,878 |
| Immigrants | Barbados | 2.6 /100 | #237 | Tragic $50,795 |
| Malaysians | 2.5 /100 | #238 | Tragic $50,772 |
| Americans | 2.5 /100 | #239 | Tragic $50,761 |
| West Indians | 2.3 /100 | #240 | Tragic $50,682 |
| Immigrants | St. Vincent and the Grenadines | 2.3 /100 | #241 | Tragic $50,665 |
| Guyanese | 2.2 /100 | #242 | Tragic $50,613 |
| French American Indians | 2.2 /100 | #243 | Tragic $50,611 |
| Houma | 2.0 /100 | #244 | Tragic $50,547 |
| Hawaiians | 1.9 /100 | #245 | Tragic $50,488 |
| Immigrants | Ecuador | 1.9 /100 | #246 | Tragic $50,474 |
| Sub-Saharan Africans | 1.8 /100 | #247 | Tragic $50,408 |
| Immigrants | Guyana | 1.6 /100 | #248 | Tragic $50,321 |
Demographics Similar to Lithuanians by Median Male Earnings
In terms of median male earnings, the demographic groups most similar to Lithuanians are Immigrants from Scotland ($61,220, a difference of 0.010%), Greek ($61,242, a difference of 0.020%), New Zealander ($61,199, a difference of 0.050%), Immigrants from Netherlands ($61,096, a difference of 0.22%), and Egyptian ($61,095, a difference of 0.22%).
| Demographics | Rating | Rank | Median Male Earnings |
| Immigrants | Europe | 99.9 /100 | #49 | Exceptional $62,057 |
| Bhutanese | 99.9 /100 | #50 | Exceptional $61,759 |
| Estonians | 99.9 /100 | #51 | Exceptional $61,710 |
| Immigrants | Norway | 99.9 /100 | #52 | Exceptional $61,628 |
| South Africans | 99.9 /100 | #53 | Exceptional $61,460 |
| Immigrants | Latvia | 99.9 /100 | #54 | Exceptional $61,422 |
| Greeks | 99.9 /100 | #55 | Exceptional $61,242 |
| Lithuanians | 99.9 /100 | #56 | Exceptional $61,228 |
| Immigrants | Scotland | 99.9 /100 | #57 | Exceptional $61,220 |
| New Zealanders | 99.9 /100 | #58 | Exceptional $61,199 |
| Immigrants | Netherlands | 99.8 /100 | #59 | Exceptional $61,096 |
| Egyptians | 99.8 /100 | #60 | Exceptional $61,095 |
| Bolivians | 99.8 /100 | #61 | Exceptional $61,066 |
| Immigrants | Romania | 99.8 /100 | #62 | Exceptional $61,040 |
| Immigrants | Pakistan | 99.8 /100 | #63 | Exceptional $60,987 |