Immigrants from Canada vs Immigrants from Israel Per Capita Income
COMPARE
Immigrants from Canada
Immigrants from Israel
Per Capita Income
Per Capita Income Comparison
Immigrants from Canada
Immigrants from Israel
$49,412
PER CAPITA INCOME
99.8/ 100
METRIC RATING
69th/ 347
METRIC RANK
$57,384
PER CAPITA INCOME
100.0/ 100
METRIC RATING
7th/ 347
METRIC RANK
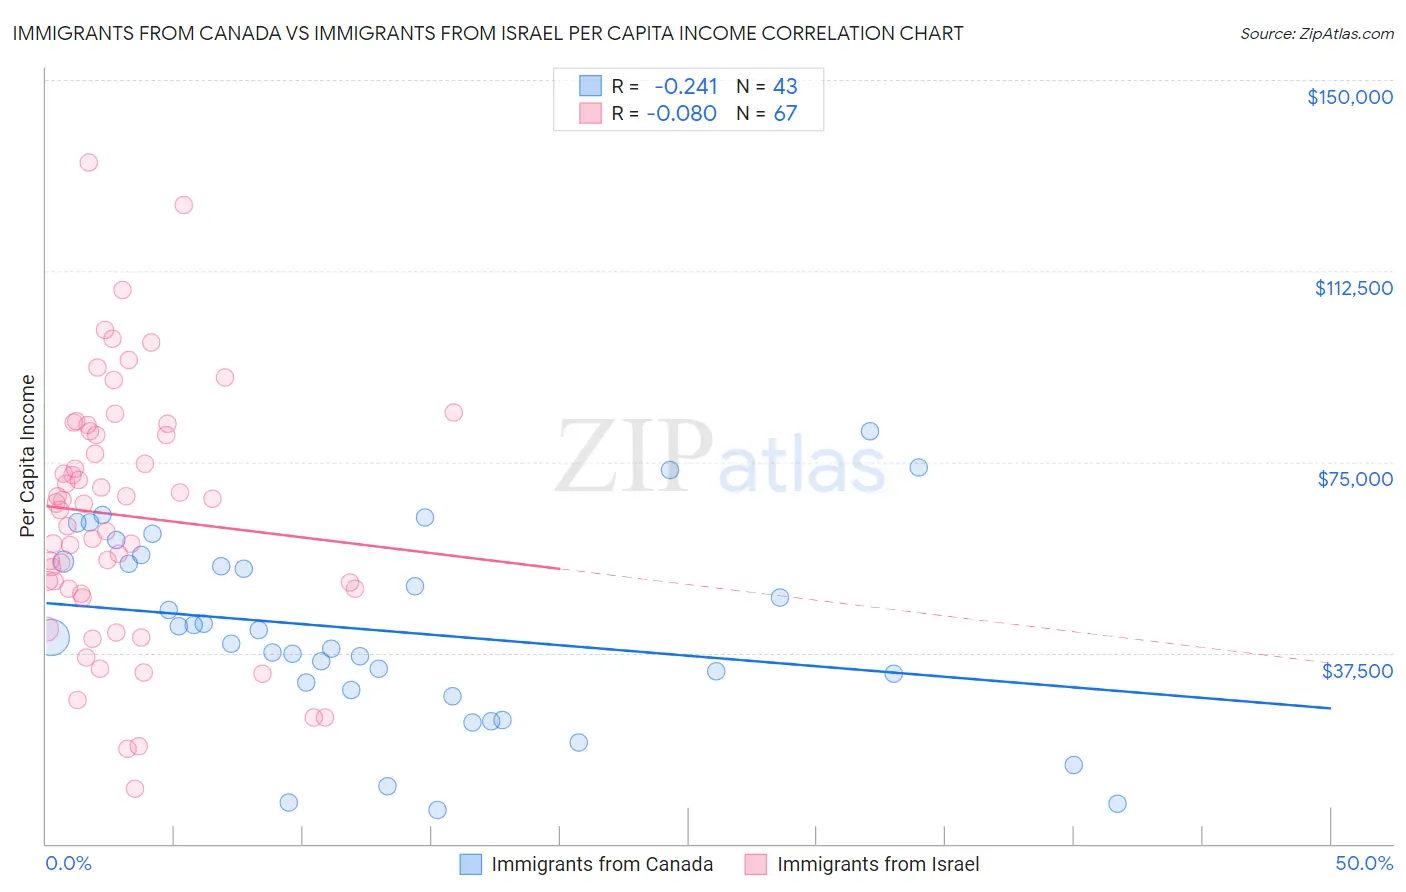
Immigrants from Canada vs Immigrants from Israel Per Capita Income Correlation Chart
The statistical analysis conducted on geographies consisting of 459,409,712 people shows a weak negative correlation between the proportion of Immigrants from Canada and per capita income in the United States with a correlation coefficient (R) of -0.241 and weighted average of $49,412. Similarly, the statistical analysis conducted on geographies consisting of 210,034,998 people shows a slight negative correlation between the proportion of Immigrants from Israel and per capita income in the United States with a correlation coefficient (R) of -0.080 and weighted average of $57,384, a difference of 16.1%.
Per Capita Income Correlation Summary
| Measurement | Immigrants from Canada | Immigrants from Israel |
| Minimum | $6,700 | $10,922 |
| Maximum | $80,940 | $133,703 |
| Range | $74,240 | $122,781 |
| Mean | $41,746 | $64,480 |
| Median | $40,519 | $66,721 |
| Interquartile 25% (IQ1) | $30,302 | $50,016 |
| Interquartile 75% (IQ3) | $55,434 | $80,903 |
| Interquartile Range (IQR) | $25,132 | $30,888 |
| Standard Deviation (Sample) | $18,564 | $24,657 |
| Standard Deviation (Population) | $18,346 | $24,473 |
Similar Demographics by Per Capita Income
Demographics Similar to Immigrants from Canada by Per Capita Income
In terms of per capita income, the demographic groups most similar to Immigrants from Canada are Lithuanian ($49,448, a difference of 0.070%), Immigrants from Romania ($49,463, a difference of 0.10%), Immigrants from Bulgaria ($49,482, a difference of 0.14%), Immigrants from Eastern Europe ($49,316, a difference of 0.20%), and Greek ($49,309, a difference of 0.21%).
| Demographics | Rating | Rank | Per Capita Income |
| Immigrants | Asia | 99.9 /100 | #62 | Exceptional $49,741 |
| Maltese | 99.9 /100 | #63 | Exceptional $49,640 |
| Immigrants | Argentina | 99.9 /100 | #64 | Exceptional $49,627 |
| Bolivians | 99.9 /100 | #65 | Exceptional $49,526 |
| Immigrants | Bulgaria | 99.9 /100 | #66 | Exceptional $49,482 |
| Immigrants | Romania | 99.9 /100 | #67 | Exceptional $49,463 |
| Lithuanians | 99.8 /100 | #68 | Exceptional $49,448 |
| Immigrants | Canada | 99.8 /100 | #69 | Exceptional $49,412 |
| Immigrants | Eastern Europe | 99.8 /100 | #70 | Exceptional $49,316 |
| Greeks | 99.8 /100 | #71 | Exceptional $49,309 |
| Immigrants | Hungary | 99.8 /100 | #72 | Exceptional $49,303 |
| Immigrants | North America | 99.8 /100 | #73 | Exceptional $49,302 |
| Mongolians | 99.8 /100 | #74 | Exceptional $49,173 |
| Immigrants | Bolivia | 99.7 /100 | #75 | Exceptional $48,970 |
| Immigrants | England | 99.7 /100 | #76 | Exceptional $48,844 |
Demographics Similar to Immigrants from Israel by Per Capita Income
In terms of per capita income, the demographic groups most similar to Immigrants from Israel are Immigrants from Taiwan ($57,742, a difference of 0.62%), Immigrants from Iran ($57,759, a difference of 0.65%), Immigrants from Australia ($57,953, a difference of 0.99%), Immigrants from Hong Kong ($56,709, a difference of 1.2%), and Immigrants from Ireland ($56,584, a difference of 1.4%).
| Demographics | Rating | Rank | Per Capita Income |
| Filipinos | 100.0 /100 | #1 | Exceptional $59,066 |
| Iranians | 100.0 /100 | #2 | Exceptional $58,786 |
| Immigrants | Singapore | 100.0 /100 | #3 | Exceptional $58,353 |
| Immigrants | Australia | 100.0 /100 | #4 | Exceptional $57,953 |
| Immigrants | Iran | 100.0 /100 | #5 | Exceptional $57,759 |
| Immigrants | Taiwan | 100.0 /100 | #6 | Exceptional $57,742 |
| Immigrants | Israel | 100.0 /100 | #7 | Exceptional $57,384 |
| Immigrants | Hong Kong | 100.0 /100 | #8 | Exceptional $56,709 |
| Immigrants | Ireland | 100.0 /100 | #9 | Exceptional $56,584 |
| Okinawans | 100.0 /100 | #10 | Exceptional $55,817 |
| Eastern Europeans | 100.0 /100 | #11 | Exceptional $55,780 |
| Immigrants | Sweden | 100.0 /100 | #12 | Exceptional $55,582 |
| Immigrants | India | 100.0 /100 | #13 | Exceptional $55,268 |
| Immigrants | Belgium | 100.0 /100 | #14 | Exceptional $55,082 |
| Cypriots | 100.0 /100 | #15 | Exceptional $54,899 |