Chilean vs Immigrants from Israel Per Capita Income
COMPARE
Chilean
Immigrants from Israel
Per Capita Income
Per Capita Income Comparison
Chileans
Immigrants from Israel
$46,459
PER CAPITA INCOME
95.9/ 100
METRIC RATING
110th/ 347
METRIC RANK
$57,384
PER CAPITA INCOME
100.0/ 100
METRIC RATING
7th/ 347
METRIC RANK
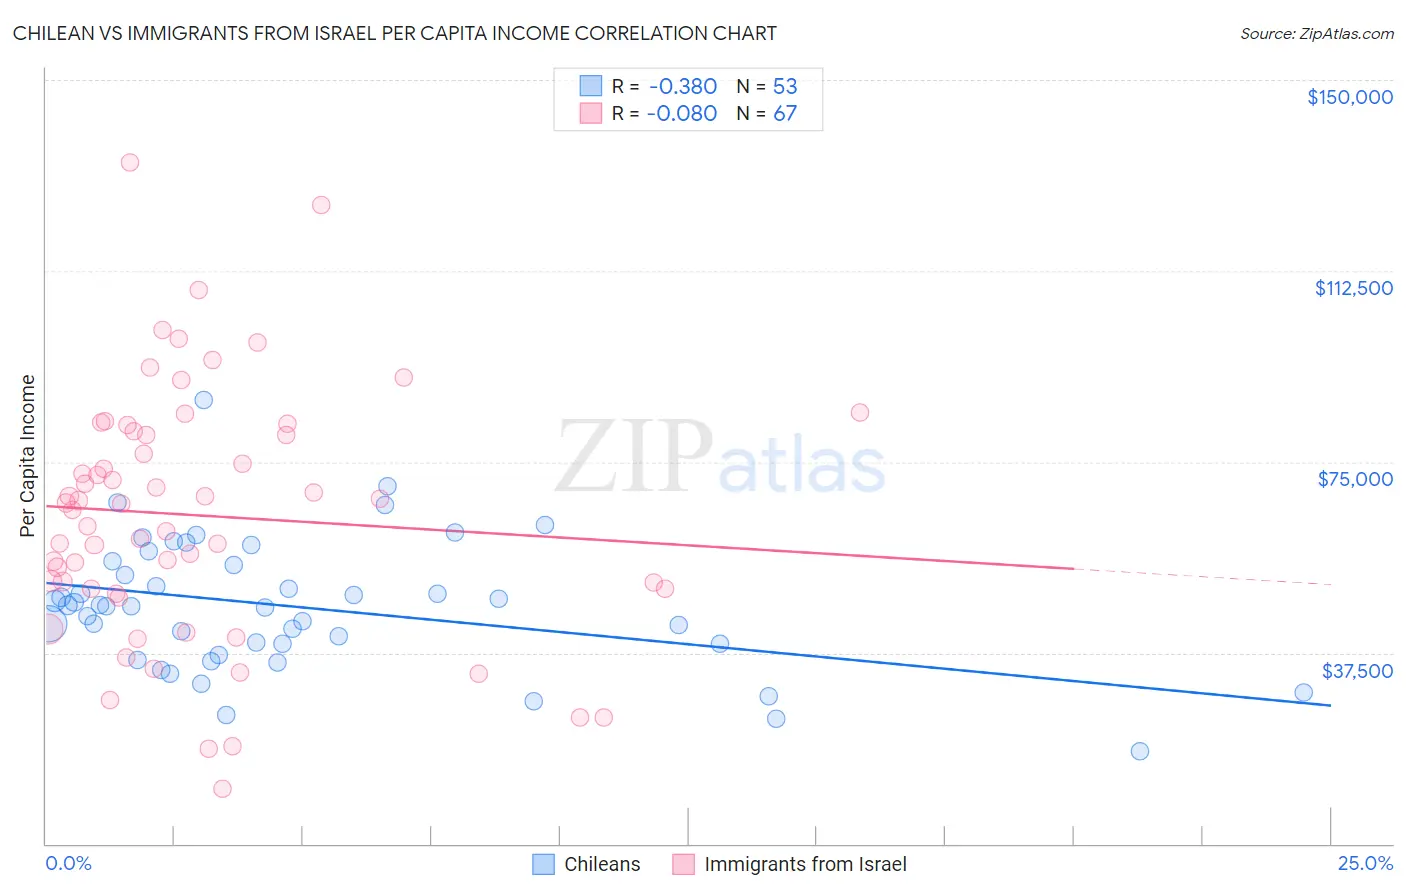
Chilean vs Immigrants from Israel Per Capita Income Correlation Chart
The statistical analysis conducted on geographies consisting of 256,682,930 people shows a mild negative correlation between the proportion of Chileans and per capita income in the United States with a correlation coefficient (R) of -0.380 and weighted average of $46,459. Similarly, the statistical analysis conducted on geographies consisting of 210,034,998 people shows a slight negative correlation between the proportion of Immigrants from Israel and per capita income in the United States with a correlation coefficient (R) of -0.080 and weighted average of $57,384, a difference of 23.5%.
Per Capita Income Correlation Summary
| Measurement | Chilean | Immigrants from Israel |
| Minimum | $18,080 | $10,922 |
| Maximum | $87,144 | $133,703 |
| Range | $69,064 | $122,781 |
| Mean | $46,506 | $64,480 |
| Median | $46,761 | $66,721 |
| Interquartile 25% (IQ1) | $38,083 | $50,016 |
| Interquartile 75% (IQ3) | $55,083 | $80,903 |
| Interquartile Range (IQR) | $17,000 | $30,888 |
| Standard Deviation (Sample) | $12,893 | $24,657 |
| Standard Deviation (Population) | $12,770 | $24,473 |
Similar Demographics by Per Capita Income
Demographics Similar to Chileans by Per Capita Income
In terms of per capita income, the demographic groups most similar to Chileans are Taiwanese ($46,455, a difference of 0.010%), Immigrants from Morocco ($46,430, a difference of 0.060%), Immigrants from Northern Africa ($46,531, a difference of 0.15%), Immigrants from Albania ($46,387, a difference of 0.15%), and Immigrants from Kuwait ($46,543, a difference of 0.18%).
| Demographics | Rating | Rank | Per Capita Income |
| Syrians | 97.2 /100 | #103 | Exceptional $46,837 |
| Brazilians | 96.8 /100 | #104 | Exceptional $46,700 |
| British | 96.3 /100 | #105 | Exceptional $46,571 |
| Ethiopians | 96.3 /100 | #106 | Exceptional $46,569 |
| Serbians | 96.2 /100 | #107 | Exceptional $46,551 |
| Immigrants | Kuwait | 96.2 /100 | #108 | Exceptional $46,543 |
| Immigrants | Northern Africa | 96.2 /100 | #109 | Exceptional $46,531 |
| Chileans | 95.9 /100 | #110 | Exceptional $46,459 |
| Taiwanese | 95.8 /100 | #111 | Exceptional $46,455 |
| Immigrants | Morocco | 95.7 /100 | #112 | Exceptional $46,430 |
| Immigrants | Albania | 95.5 /100 | #113 | Exceptional $46,387 |
| Afghans | 94.9 /100 | #114 | Exceptional $46,268 |
| Immigrants | Chile | 94.6 /100 | #115 | Exceptional $46,213 |
| Poles | 94.1 /100 | #116 | Exceptional $46,123 |
| Chinese | 93.9 /100 | #117 | Exceptional $46,098 |
Demographics Similar to Immigrants from Israel by Per Capita Income
In terms of per capita income, the demographic groups most similar to Immigrants from Israel are Immigrants from Taiwan ($57,742, a difference of 0.62%), Immigrants from Iran ($57,759, a difference of 0.65%), Immigrants from Australia ($57,953, a difference of 0.99%), Immigrants from Hong Kong ($56,709, a difference of 1.2%), and Immigrants from Ireland ($56,584, a difference of 1.4%).
| Demographics | Rating | Rank | Per Capita Income |
| Filipinos | 100.0 /100 | #1 | Exceptional $59,066 |
| Iranians | 100.0 /100 | #2 | Exceptional $58,786 |
| Immigrants | Singapore | 100.0 /100 | #3 | Exceptional $58,353 |
| Immigrants | Australia | 100.0 /100 | #4 | Exceptional $57,953 |
| Immigrants | Iran | 100.0 /100 | #5 | Exceptional $57,759 |
| Immigrants | Taiwan | 100.0 /100 | #6 | Exceptional $57,742 |
| Immigrants | Israel | 100.0 /100 | #7 | Exceptional $57,384 |
| Immigrants | Hong Kong | 100.0 /100 | #8 | Exceptional $56,709 |
| Immigrants | Ireland | 100.0 /100 | #9 | Exceptional $56,584 |
| Okinawans | 100.0 /100 | #10 | Exceptional $55,817 |
| Eastern Europeans | 100.0 /100 | #11 | Exceptional $55,780 |
| Immigrants | Sweden | 100.0 /100 | #12 | Exceptional $55,582 |
| Immigrants | India | 100.0 /100 | #13 | Exceptional $55,268 |
| Immigrants | Belgium | 100.0 /100 | #14 | Exceptional $55,082 |
| Cypriots | 100.0 /100 | #15 | Exceptional $54,899 |