Canadian vs Immigrants from Denmark Per Capita Income
COMPARE
Canadian
Immigrants from Denmark
Per Capita Income
Per Capita Income Comparison
Canadians
Immigrants from Denmark
$45,858
PER CAPITA INCOME
92.2/ 100
METRIC RATING
121st/ 347
METRIC RANK
$53,799
PER CAPITA INCOME
100.0/ 100
METRIC RATING
24th/ 347
METRIC RANK
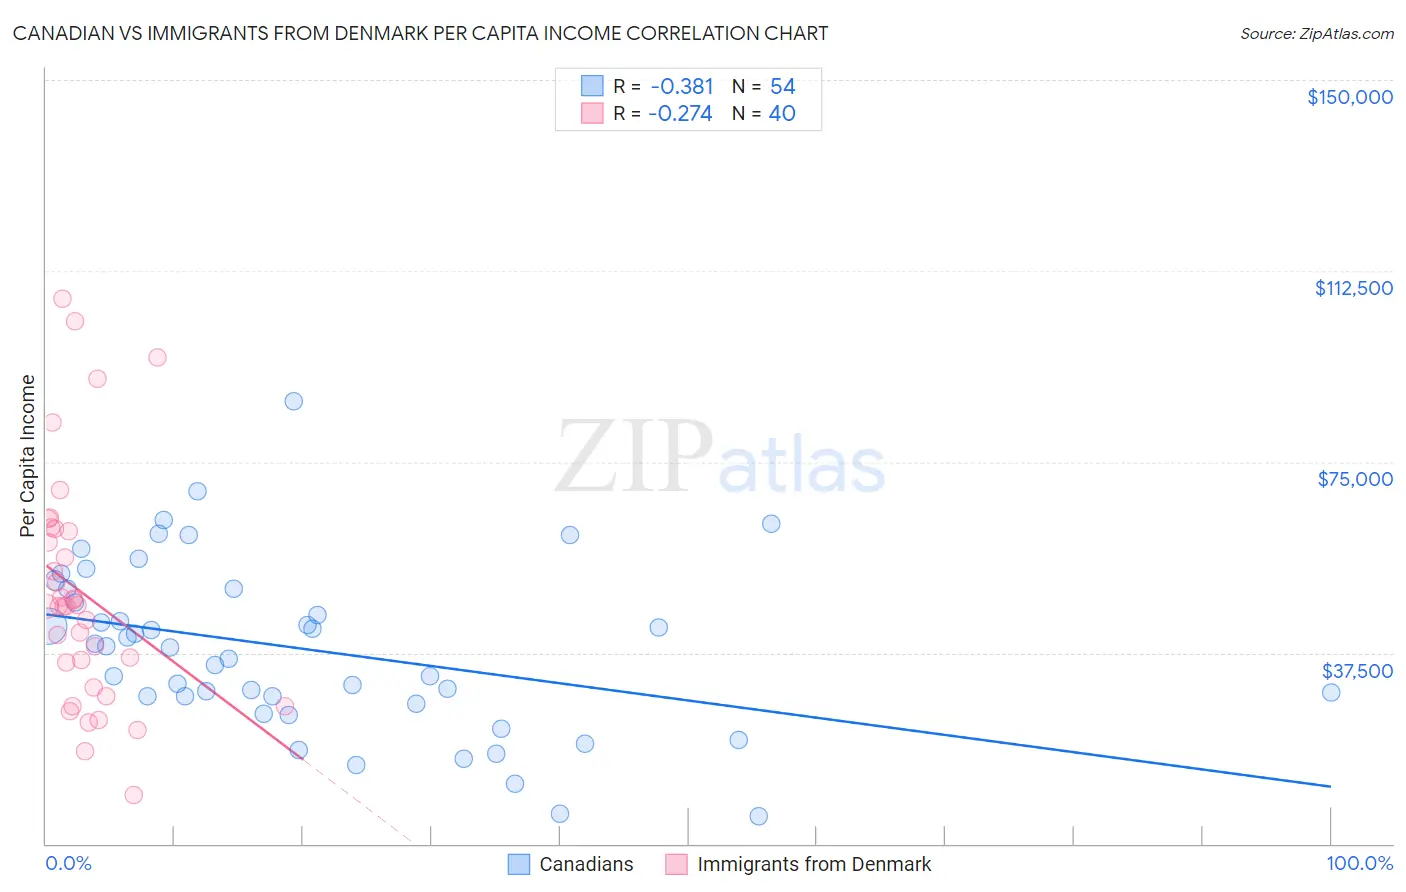
Canadian vs Immigrants from Denmark Per Capita Income Correlation Chart
The statistical analysis conducted on geographies consisting of 437,574,482 people shows a mild negative correlation between the proportion of Canadians and per capita income in the United States with a correlation coefficient (R) of -0.381 and weighted average of $45,858. Similarly, the statistical analysis conducted on geographies consisting of 136,433,467 people shows a weak negative correlation between the proportion of Immigrants from Denmark and per capita income in the United States with a correlation coefficient (R) of -0.274 and weighted average of $53,799, a difference of 17.3%.
Per Capita Income Correlation Summary
| Measurement | Canadian | Immigrants from Denmark |
| Minimum | $5,500 | $9,511 |
| Maximum | $86,868 | $106,981 |
| Range | $81,368 | $97,470 |
| Mean | $38,269 | $49,281 |
| Median | $38,676 | $46,658 |
| Interquartile 25% (IQ1) | $28,934 | $33,062 |
| Interquartile 75% (IQ3) | $50,164 | $61,546 |
| Interquartile Range (IQR) | $21,231 | $28,484 |
| Standard Deviation (Sample) | $16,643 | $22,845 |
| Standard Deviation (Population) | $16,488 | $22,558 |
Similar Demographics by Per Capita Income
Demographics Similar to Canadians by Per Capita Income
In terms of per capita income, the demographic groups most similar to Canadians are Moroccan ($45,854, a difference of 0.010%), Lebanese ($45,840, a difference of 0.040%), European ($45,836, a difference of 0.050%), Zimbabwean ($45,804, a difference of 0.12%), and Immigrants from Ethiopia ($45,923, a difference of 0.14%).
| Demographics | Rating | Rank | Per Capita Income |
| Afghans | 94.9 /100 | #114 | Exceptional $46,268 |
| Immigrants | Chile | 94.6 /100 | #115 | Exceptional $46,213 |
| Poles | 94.1 /100 | #116 | Exceptional $46,123 |
| Chinese | 93.9 /100 | #117 | Exceptional $46,098 |
| Immigrants | Saudi Arabia | 93.3 /100 | #118 | Exceptional $46,008 |
| Immigrants | Poland | 93.1 /100 | #119 | Exceptional $45,979 |
| Immigrants | Ethiopia | 92.7 /100 | #120 | Exceptional $45,923 |
| Canadians | 92.2 /100 | #121 | Exceptional $45,858 |
| Moroccans | 92.1 /100 | #122 | Exceptional $45,854 |
| Lebanese | 92.0 /100 | #123 | Exceptional $45,840 |
| Europeans | 92.0 /100 | #124 | Exceptional $45,836 |
| Zimbabweans | 91.7 /100 | #125 | Exceptional $45,804 |
| Palestinians | 91.6 /100 | #126 | Exceptional $45,790 |
| Immigrants | Germany | 91.3 /100 | #127 | Exceptional $45,751 |
| Swedes | 91.3 /100 | #128 | Exceptional $45,750 |
Demographics Similar to Immigrants from Denmark by Per Capita Income
In terms of per capita income, the demographic groups most similar to Immigrants from Denmark are Immigrants from Eastern Asia ($53,806, a difference of 0.010%), Indian (Asian) ($53,874, a difference of 0.14%), Immigrants from Northern Europe ($54,159, a difference of 0.67%), Soviet Union ($54,202, a difference of 0.75%), and Immigrants from Japan ($53,359, a difference of 0.82%).
| Demographics | Rating | Rank | Per Capita Income |
| Immigrants | France | 100.0 /100 | #17 | Exceptional $54,557 |
| Thais | 100.0 /100 | #18 | Exceptional $54,307 |
| Immigrants | China | 100.0 /100 | #19 | Exceptional $54,264 |
| Soviet Union | 100.0 /100 | #20 | Exceptional $54,202 |
| Immigrants | Northern Europe | 100.0 /100 | #21 | Exceptional $54,159 |
| Indians (Asian) | 100.0 /100 | #22 | Exceptional $53,874 |
| Immigrants | Eastern Asia | 100.0 /100 | #23 | Exceptional $53,806 |
| Immigrants | Denmark | 100.0 /100 | #24 | Exceptional $53,799 |
| Immigrants | Japan | 100.0 /100 | #25 | Exceptional $53,359 |
| Russians | 100.0 /100 | #26 | Exceptional $53,154 |
| Immigrants | South Central Asia | 100.0 /100 | #27 | Exceptional $52,660 |
| Latvians | 100.0 /100 | #28 | Exceptional $52,649 |
| Israelis | 100.0 /100 | #29 | Exceptional $52,596 |
| Immigrants | Austria | 100.0 /100 | #30 | Exceptional $52,503 |
| Turks | 100.0 /100 | #31 | Exceptional $52,391 |