Croatian vs Immigrants from Middle Africa Median Household Income
COMPARE
Croatian
Immigrants from Middle Africa
Median Household Income
Median Household Income Comparison
Croatians
Immigrants from Middle Africa
$90,685
MEDIAN HOUSEHOLD INCOME
97.3/ 100
METRIC RATING
107th/ 347
METRIC RANK
$77,559
MEDIAN HOUSEHOLD INCOME
0.8/ 100
METRIC RATING
255th/ 347
METRIC RANK
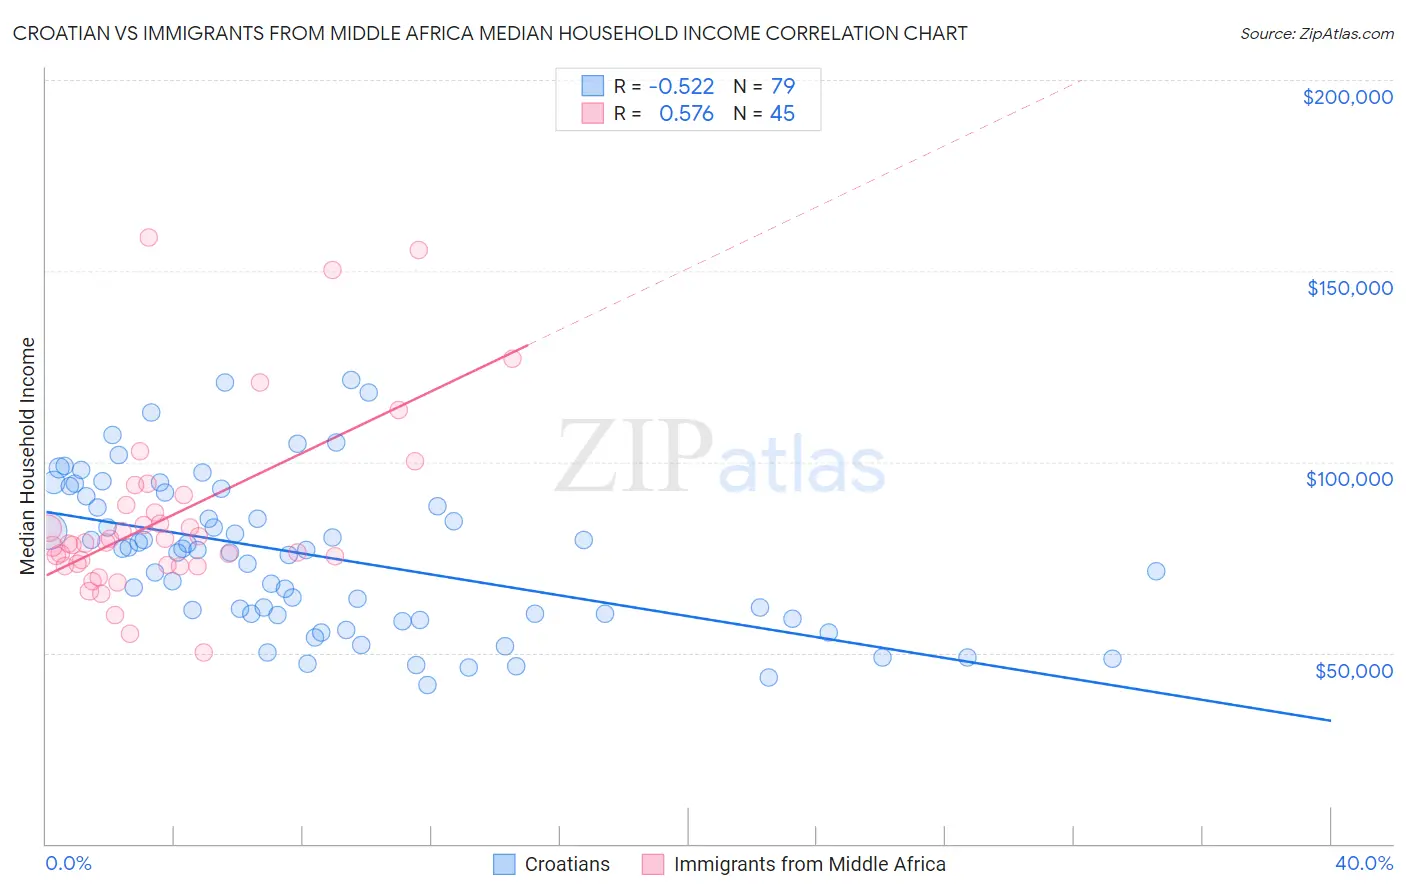
Croatian vs Immigrants from Middle Africa Median Household Income Correlation Chart
The statistical analysis conducted on geographies consisting of 375,471,157 people shows a substantial negative correlation between the proportion of Croatians and median household income in the United States with a correlation coefficient (R) of -0.522 and weighted average of $90,685. Similarly, the statistical analysis conducted on geographies consisting of 202,637,900 people shows a substantial positive correlation between the proportion of Immigrants from Middle Africa and median household income in the United States with a correlation coefficient (R) of 0.576 and weighted average of $77,559, a difference of 16.9%.
Median Household Income Correlation Summary
| Measurement | Croatian | Immigrants from Middle Africa |
| Minimum | $41,696 | $50,020 |
| Maximum | $121,425 | $158,604 |
| Range | $79,729 | $108,584 |
| Mean | $75,345 | $85,598 |
| Median | $76,836 | $78,726 |
| Interquartile 25% (IQ1) | $59,949 | $72,847 |
| Interquartile 75% (IQ3) | $91,012 | $90,002 |
| Interquartile Range (IQR) | $31,063 | $17,155 |
| Standard Deviation (Sample) | $19,789 | $23,894 |
| Standard Deviation (Population) | $19,663 | $23,627 |
Similar Demographics by Median Household Income
Demographics Similar to Croatians by Median Household Income
In terms of median household income, the demographic groups most similar to Croatians are Zimbabwean ($90,618, a difference of 0.070%), Macedonian ($90,761, a difference of 0.080%), Chilean ($90,605, a difference of 0.090%), Palestinian ($90,574, a difference of 0.12%), and Immigrants from Poland ($90,549, a difference of 0.15%).
| Demographics | Rating | Rank | Median Household Income |
| Ukrainians | 98.3 /100 | #100 | Exceptional $91,456 |
| Immigrants | Moldova | 98.3 /100 | #101 | Exceptional $91,446 |
| Austrians | 98.2 /100 | #102 | Exceptional $91,339 |
| Immigrants | Ukraine | 98.0 /100 | #103 | Exceptional $91,124 |
| Immigrants | Kazakhstan | 97.8 /100 | #104 | Exceptional $91,015 |
| Immigrants | Brazil | 97.7 /100 | #105 | Exceptional $90,907 |
| Macedonians | 97.4 /100 | #106 | Exceptional $90,761 |
| Croatians | 97.3 /100 | #107 | Exceptional $90,685 |
| Zimbabweans | 97.2 /100 | #108 | Exceptional $90,618 |
| Chileans | 97.2 /100 | #109 | Exceptional $90,605 |
| Palestinians | 97.1 /100 | #110 | Exceptional $90,574 |
| Immigrants | Poland | 97.1 /100 | #111 | Exceptional $90,549 |
| Northern Europeans | 96.9 /100 | #112 | Exceptional $90,446 |
| Peruvians | 96.5 /100 | #113 | Exceptional $90,261 |
| Immigrants | Northern Africa | 95.9 /100 | #114 | Exceptional $90,026 |
Demographics Similar to Immigrants from Middle Africa by Median Household Income
In terms of median household income, the demographic groups most similar to Immigrants from Middle Africa are Subsaharan African ($77,631, a difference of 0.090%), Immigrants from St. Vincent and the Grenadines ($77,690, a difference of 0.17%), Immigrants from West Indies ($77,956, a difference of 0.51%), Belizean ($77,028, a difference of 0.69%), and Mexican American Indian ($78,166, a difference of 0.78%).
| Demographics | Rating | Rank | Median Household Income |
| Sudanese | 1.5 /100 | #248 | Tragic $78,529 |
| West Indians | 1.4 /100 | #249 | Tragic $78,455 |
| Immigrants | Laos | 1.3 /100 | #250 | Tragic $78,327 |
| Mexican American Indians | 1.2 /100 | #251 | Tragic $78,166 |
| Immigrants | West Indies | 1.0 /100 | #252 | Tragic $77,956 |
| Immigrants | St. Vincent and the Grenadines | 0.9 /100 | #253 | Tragic $77,690 |
| Sub-Saharan Africans | 0.8 /100 | #254 | Tragic $77,631 |
| Immigrants | Middle Africa | 0.8 /100 | #255 | Tragic $77,559 |
| Belizeans | 0.6 /100 | #256 | Tragic $77,028 |
| Immigrants | Senegal | 0.5 /100 | #257 | Tragic $76,915 |
| Immigrants | Nicaragua | 0.5 /100 | #258 | Tragic $76,784 |
| Spanish American Indians | 0.4 /100 | #259 | Tragic $76,670 |
| Jamaicans | 0.4 /100 | #260 | Tragic $76,583 |
| Immigrants | Grenada | 0.4 /100 | #261 | Tragic $76,517 |
| French American Indians | 0.4 /100 | #262 | Tragic $76,387 |