Croatian vs Immigrants from Ecuador Median Household Income
COMPARE
Croatian
Immigrants from Ecuador
Median Household Income
Median Household Income Comparison
Croatians
Immigrants from Ecuador
$90,685
MEDIAN HOUSEHOLD INCOME
97.3/ 100
METRIC RATING
107th/ 347
METRIC RANK
$80,341
MEDIAN HOUSEHOLD INCOME
4.5/ 100
METRIC RATING
234th/ 347
METRIC RANK
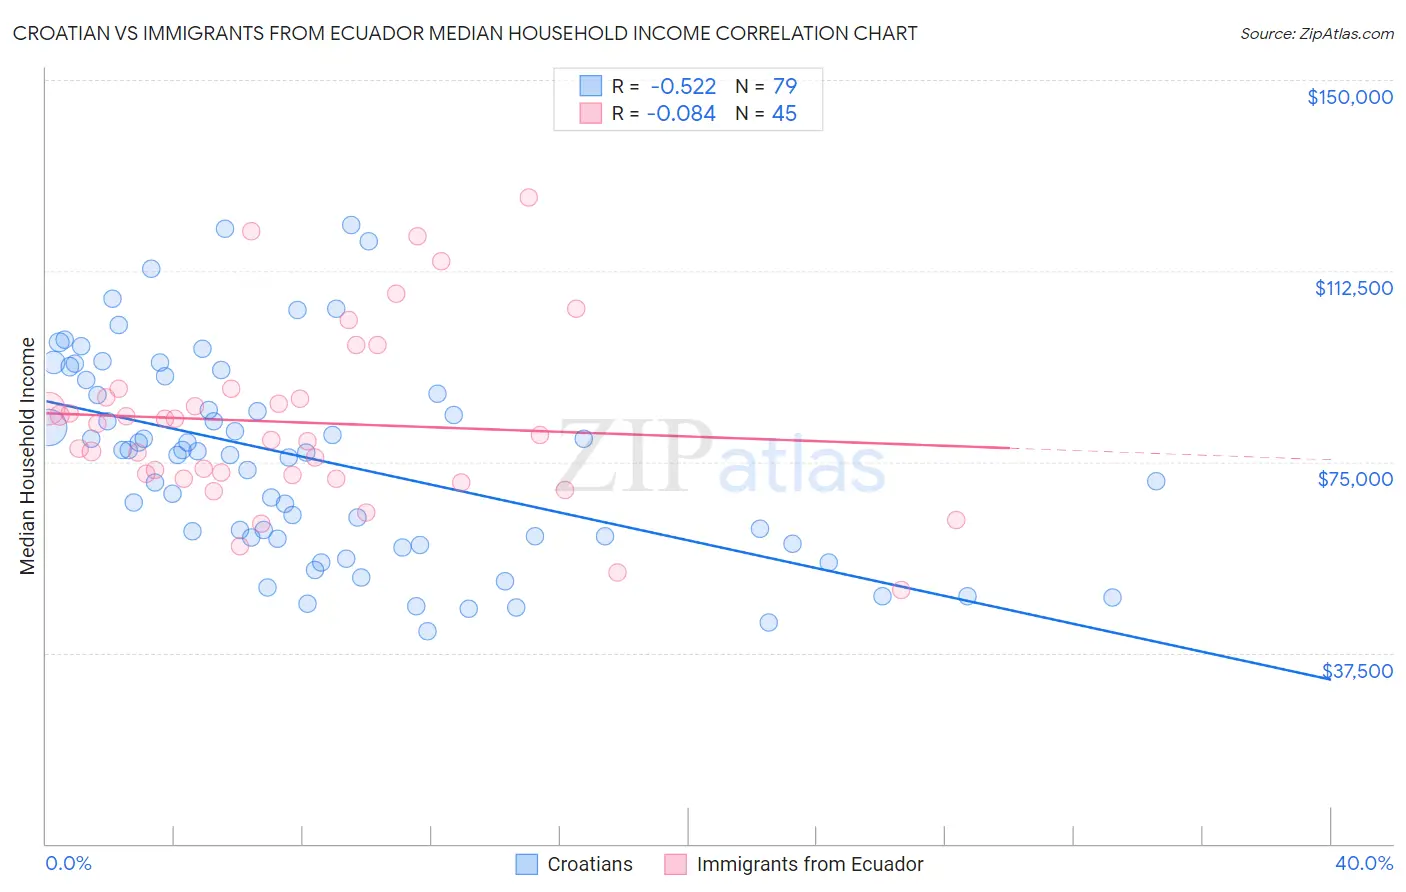
Croatian vs Immigrants from Ecuador Median Household Income Correlation Chart
The statistical analysis conducted on geographies consisting of 375,471,157 people shows a substantial negative correlation between the proportion of Croatians and median household income in the United States with a correlation coefficient (R) of -0.522 and weighted average of $90,685. Similarly, the statistical analysis conducted on geographies consisting of 270,856,843 people shows a slight negative correlation between the proportion of Immigrants from Ecuador and median household income in the United States with a correlation coefficient (R) of -0.084 and weighted average of $80,341, a difference of 12.9%.
Median Household Income Correlation Summary
| Measurement | Croatian | Immigrants from Ecuador |
| Minimum | $41,696 | $49,886 |
| Maximum | $121,425 | $126,873 |
| Range | $79,729 | $76,987 |
| Mean | $75,345 | $82,745 |
| Median | $76,836 | $80,365 |
| Interquartile 25% (IQ1) | $59,949 | $72,009 |
| Interquartile 75% (IQ3) | $91,012 | $88,454 |
| Interquartile Range (IQR) | $31,063 | $16,444 |
| Standard Deviation (Sample) | $19,789 | $17,127 |
| Standard Deviation (Population) | $19,663 | $16,935 |
Similar Demographics by Median Household Income
Demographics Similar to Croatians by Median Household Income
In terms of median household income, the demographic groups most similar to Croatians are Zimbabwean ($90,618, a difference of 0.070%), Macedonian ($90,761, a difference of 0.080%), Chilean ($90,605, a difference of 0.090%), Palestinian ($90,574, a difference of 0.12%), and Immigrants from Poland ($90,549, a difference of 0.15%).
| Demographics | Rating | Rank | Median Household Income |
| Ukrainians | 98.3 /100 | #100 | Exceptional $91,456 |
| Immigrants | Moldova | 98.3 /100 | #101 | Exceptional $91,446 |
| Austrians | 98.2 /100 | #102 | Exceptional $91,339 |
| Immigrants | Ukraine | 98.0 /100 | #103 | Exceptional $91,124 |
| Immigrants | Kazakhstan | 97.8 /100 | #104 | Exceptional $91,015 |
| Immigrants | Brazil | 97.7 /100 | #105 | Exceptional $90,907 |
| Macedonians | 97.4 /100 | #106 | Exceptional $90,761 |
| Croatians | 97.3 /100 | #107 | Exceptional $90,685 |
| Zimbabweans | 97.2 /100 | #108 | Exceptional $90,618 |
| Chileans | 97.2 /100 | #109 | Exceptional $90,605 |
| Palestinians | 97.1 /100 | #110 | Exceptional $90,574 |
| Immigrants | Poland | 97.1 /100 | #111 | Exceptional $90,549 |
| Northern Europeans | 96.9 /100 | #112 | Exceptional $90,446 |
| Peruvians | 96.5 /100 | #113 | Exceptional $90,261 |
| Immigrants | Northern Africa | 95.9 /100 | #114 | Exceptional $90,026 |
Demographics Similar to Immigrants from Ecuador by Median Household Income
In terms of median household income, the demographic groups most similar to Immigrants from Ecuador are Immigrants from the Azores ($80,357, a difference of 0.020%), Immigrants from Guyana ($80,324, a difference of 0.020%), Immigrants from Trinidad and Tobago ($80,373, a difference of 0.040%), Bermudan ($80,406, a difference of 0.080%), and Trinidadian and Tobagonian ($80,402, a difference of 0.080%).
| Demographics | Rating | Rank | Median Household Income |
| Guyanese | 5.7 /100 | #227 | Tragic $80,734 |
| Immigrants | Bangladesh | 5.7 /100 | #228 | Tragic $80,722 |
| Delaware | 5.0 /100 | #229 | Tragic $80,527 |
| Bermudans | 4.7 /100 | #230 | Tragic $80,406 |
| Trinidadians and Tobagonians | 4.7 /100 | #231 | Tragic $80,402 |
| Immigrants | Trinidad and Tobago | 4.6 /100 | #232 | Tragic $80,373 |
| Immigrants | Azores | 4.5 /100 | #233 | Tragic $80,357 |
| Immigrants | Ecuador | 4.5 /100 | #234 | Tragic $80,341 |
| Immigrants | Guyana | 4.5 /100 | #235 | Tragic $80,324 |
| Immigrants | Bosnia and Herzegovina | 3.4 /100 | #236 | Tragic $79,888 |
| Nicaraguans | 3.1 /100 | #237 | Tragic $79,737 |
| Barbadians | 3.0 /100 | #238 | Tragic $79,664 |
| Alaska Natives | 2.7 /100 | #239 | Tragic $79,509 |
| Immigrants | Western Africa | 2.7 /100 | #240 | Tragic $79,490 |
| Immigrants | Nonimmigrants | 2.6 /100 | #241 | Tragic $79,429 |