Croatian vs French Canadian Average Family Size
COMPARE
Croatian
French Canadian
Average Family Size
Average Family Size Comparison
Croatians
French Canadians
3.10
AVERAGE FAMILY SIZE
0.0/ 100
METRIC RATING
339th/ 347
METRIC RANK
3.07
AVERAGE FAMILY SIZE
0.0/ 100
METRIC RATING
344th/ 347
METRIC RANK
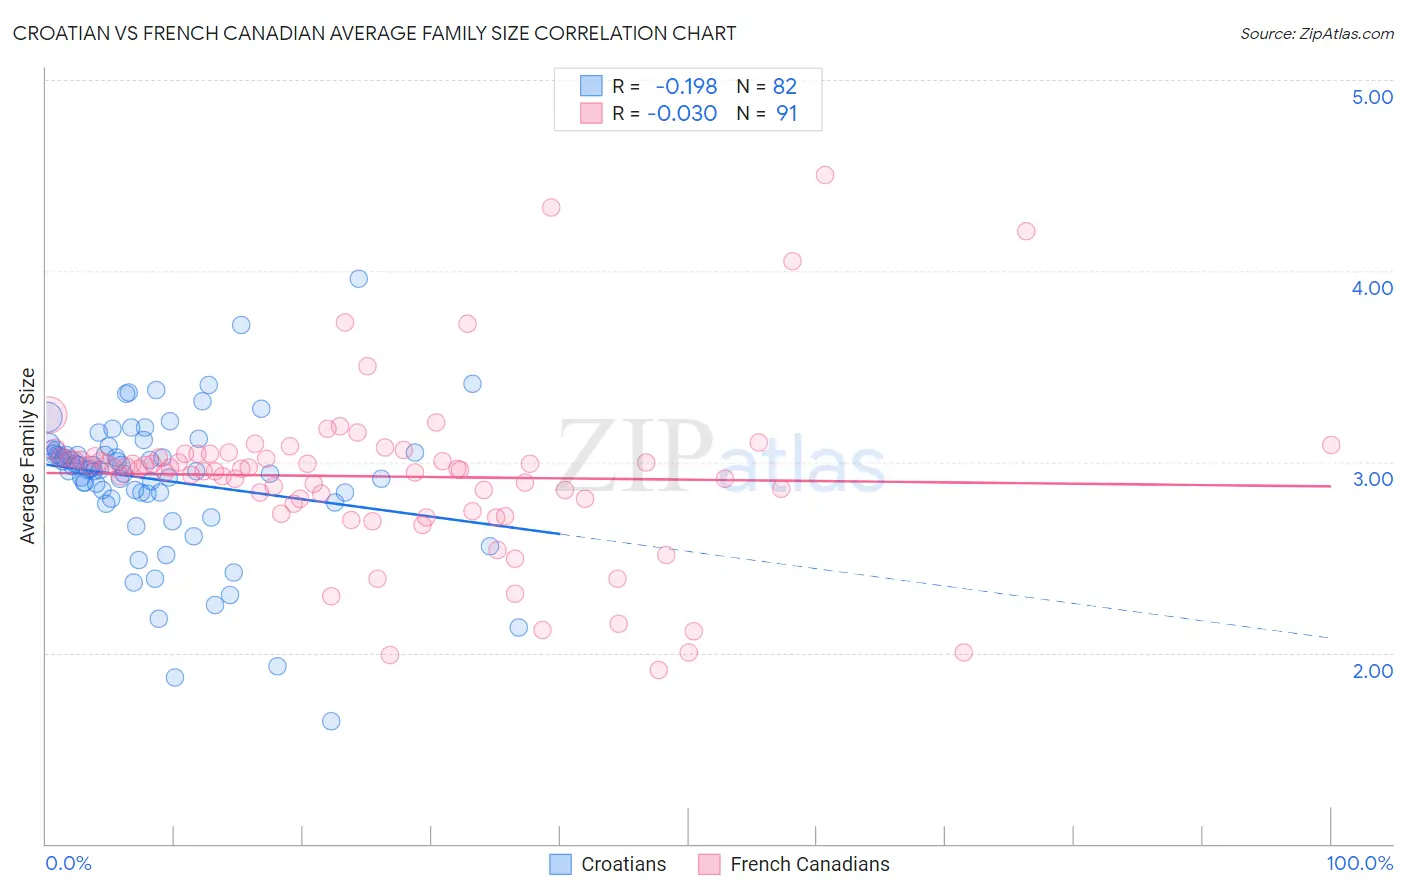
Croatian vs French Canadian Average Family Size Correlation Chart
The statistical analysis conducted on geographies consisting of 375,543,133 people shows a poor negative correlation between the proportion of Croatians and average family size in the United States with a correlation coefficient (R) of -0.198 and weighted average of 3.10. Similarly, the statistical analysis conducted on geographies consisting of 502,268,768 people shows no correlation between the proportion of French Canadians and average family size in the United States with a correlation coefficient (R) of -0.030 and weighted average of 3.07, a difference of 0.81%.
Average Family Size Correlation Summary
| Measurement | Croatian | French Canadian |
| Minimum | 1.64 | 1.91 |
| Maximum | 3.96 | 4.50 |
| Range | 2.32 | 2.59 |
| Mean | 2.90 | 2.92 |
| Median | 2.96 | 2.97 |
| Interquartile 25% (IQ1) | 2.83 | 2.78 |
| Interquartile 75% (IQ3) | 3.06 | 3.04 |
| Interquartile Range (IQR) | 0.23 | 0.26 |
| Standard Deviation (Sample) | 0.37 | 0.44 |
| Standard Deviation (Population) | 0.37 | 0.44 |
Demographics Similar to Croatians and French Canadians by Average Family Size
In terms of average family size, the demographic groups most similar to Croatians are French (3.10, a difference of 0.010%), Swedish (3.10, a difference of 0.030%), Irish (3.10, a difference of 0.070%), Luxembourger (3.10, a difference of 0.13%), and Finnish (3.09, a difference of 0.14%). Similarly, the demographic groups most similar to French Canadians are Slovene (3.07, a difference of 0.040%), Norwegian (3.08, a difference of 0.24%), Slovak (3.06, a difference of 0.33%), Carpatho Rusyn (3.06, a difference of 0.39%), and German (3.09, a difference of 0.47%).
| Demographics | Rating | Rank | Average Family Size |
| Czechs | 0.0 /100 | #328 | Tragic 3.11 |
| Belgians | 0.0 /100 | #329 | Tragic 3.11 |
| Latvians | 0.0 /100 | #330 | Tragic 3.11 |
| Scotch-Irish | 0.0 /100 | #331 | Tragic 3.11 |
| Scottish | 0.0 /100 | #332 | Tragic 3.11 |
| Estonians | 0.0 /100 | #333 | Tragic 3.10 |
| Lithuanians | 0.0 /100 | #334 | Tragic 3.10 |
| Luxembourgers | 0.0 /100 | #335 | Tragic 3.10 |
| Irish | 0.0 /100 | #336 | Tragic 3.10 |
| Swedes | 0.0 /100 | #337 | Tragic 3.10 |
| French | 0.0 /100 | #338 | Tragic 3.10 |
| Croatians | 0.0 /100 | #339 | Tragic 3.10 |
| Finns | 0.0 /100 | #340 | Tragic 3.09 |
| Poles | 0.0 /100 | #341 | Tragic 3.09 |
| Germans | 0.0 /100 | #342 | Tragic 3.09 |
| Norwegians | 0.0 /100 | #343 | Tragic 3.08 |
| French Canadians | 0.0 /100 | #344 | Tragic 3.07 |
| Slovenes | 0.0 /100 | #345 | Tragic 3.07 |
| Slovaks | 0.0 /100 | #346 | Tragic 3.06 |
| Carpatho Rusyns | 0.0 /100 | #347 | Tragic 3.06 |