Creek vs Immigrants from Croatia Unemployment Among Ages 35 to 44 years
COMPARE
Creek
Immigrants from Croatia
Unemployment Among Ages 35 to 44 years
Unemployment Among Ages 35 to 44 years Comparison
Creek
Immigrants from Croatia
5.4%
UNEMPLOYMENT AMONG AGES 35 TO 44 YEARS
0.0/ 100
METRIC RATING
274th/ 347
METRIC RANK
4.6%
UNEMPLOYMENT AMONG AGES 35 TO 44 YEARS
83.1/ 100
METRIC RATING
129th/ 347
METRIC RANK
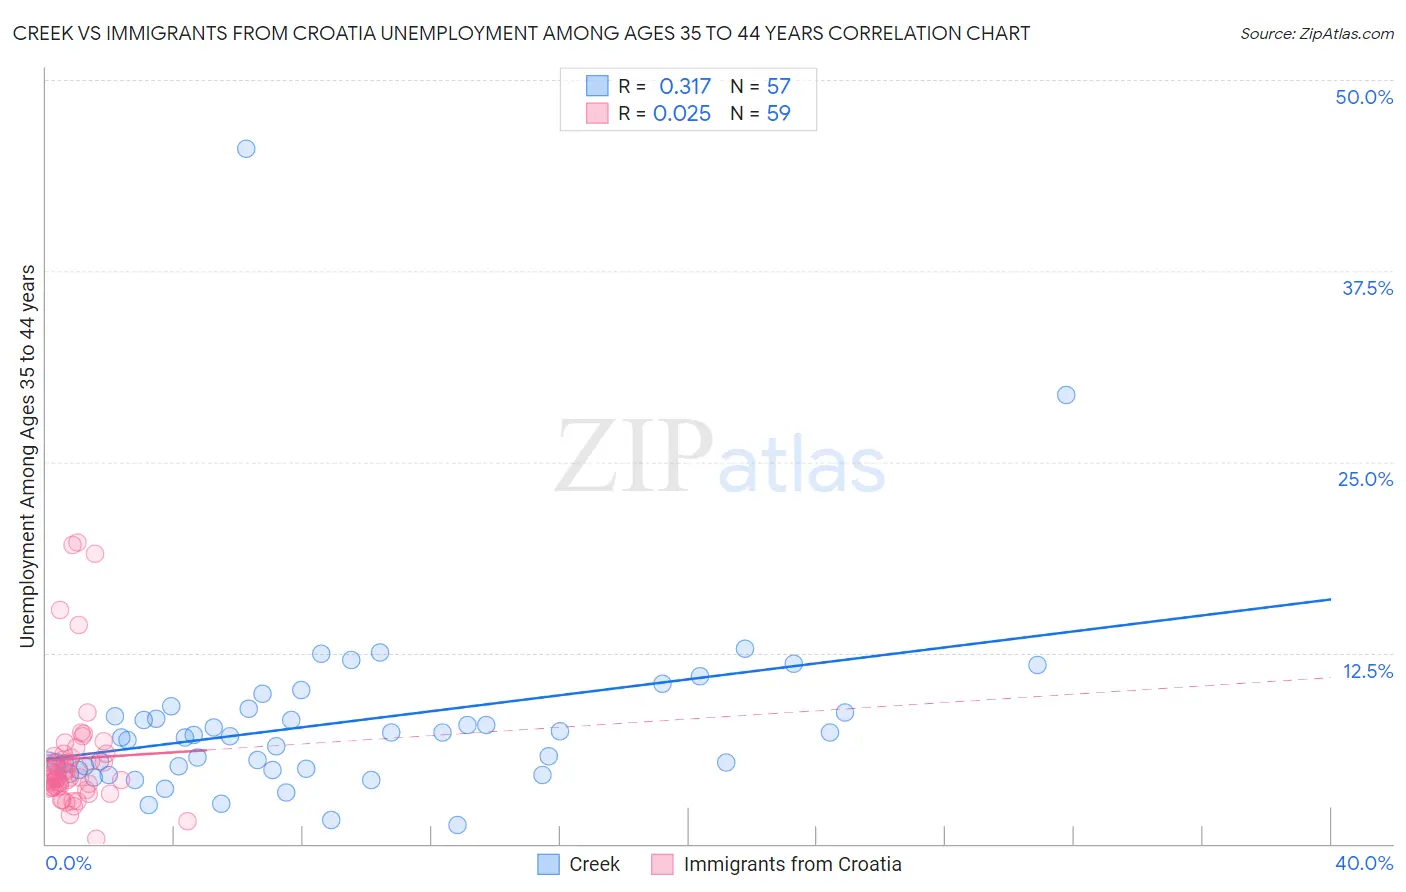
Creek vs Immigrants from Croatia Unemployment Among Ages 35 to 44 years Correlation Chart
The statistical analysis conducted on geographies consisting of 176,113,795 people shows a mild positive correlation between the proportion of Creek and unemployment rate among population between the ages 35 and 44 in the United States with a correlation coefficient (R) of 0.317 and weighted average of 5.4%. Similarly, the statistical analysis conducted on geographies consisting of 131,759,481 people shows no correlation between the proportion of Immigrants from Croatia and unemployment rate among population between the ages 35 and 44 in the United States with a correlation coefficient (R) of 0.025 and weighted average of 4.6%, a difference of 17.6%.
Unemployment Among Ages 35 to 44 years Correlation Summary
| Measurement | Creek | Immigrants from Croatia |
| Minimum | 1.2% | 0.30% |
| Maximum | 45.5% | 19.7% |
| Range | 44.3% | 19.4% |
| Mean | 7.9% | 5.6% |
| Median | 7.0% | 4.3% |
| Interquartile 25% (IQ1) | 4.8% | 3.7% |
| Interquartile 75% (IQ3) | 8.7% | 5.8% |
| Interquartile Range (IQR) | 3.9% | 2.1% |
| Standard Deviation (Sample) | 6.5% | 4.0% |
| Standard Deviation (Population) | 6.5% | 4.0% |
Similar Demographics by Unemployment Among Ages 35 to 44 years
Demographics Similar to Creek by Unemployment Among Ages 35 to 44 years
In terms of unemployment among ages 35 to 44 years, the demographic groups most similar to Creek are Vietnamese (5.4%, a difference of 0.040%), Immigrants from Mexico (5.4%, a difference of 0.080%), Native Hawaiian (5.4%, a difference of 0.080%), Immigrants from Caribbean (5.4%, a difference of 0.16%), and Senegalese (5.3%, a difference of 0.22%).
| Demographics | Rating | Rank | Unemployment Among Ages 35 to 44 years |
| Immigrants | Western Africa | 0.0 /100 | #267 | Tragic 5.3% |
| Hawaiians | 0.0 /100 | #268 | Tragic 5.3% |
| Cajuns | 0.0 /100 | #269 | Tragic 5.3% |
| Blackfeet | 0.0 /100 | #270 | Tragic 5.3% |
| Ute | 0.0 /100 | #271 | Tragic 5.3% |
| Senegalese | 0.0 /100 | #272 | Tragic 5.3% |
| Vietnamese | 0.0 /100 | #273 | Tragic 5.4% |
| Creek | 0.0 /100 | #274 | Tragic 5.4% |
| Immigrants | Mexico | 0.0 /100 | #275 | Tragic 5.4% |
| Native Hawaiians | 0.0 /100 | #276 | Tragic 5.4% |
| Immigrants | Caribbean | 0.0 /100 | #277 | Tragic 5.4% |
| Lumbee | 0.0 /100 | #278 | Tragic 5.4% |
| Immigrants | Senegal | 0.0 /100 | #279 | Tragic 5.4% |
| Ecuadorians | 0.0 /100 | #280 | Tragic 5.4% |
| Immigrants | Portugal | 0.0 /100 | #281 | Tragic 5.4% |
Demographics Similar to Immigrants from Croatia by Unemployment Among Ages 35 to 44 years
In terms of unemployment among ages 35 to 44 years, the demographic groups most similar to Immigrants from Croatia are Czechoslovakian (4.6%, a difference of 0.040%), Immigrants from Eritrea (4.6%, a difference of 0.040%), Immigrants from Colombia (4.6%, a difference of 0.060%), Immigrants from Ethiopia (4.5%, a difference of 0.21%), and Immigrants from Austria (4.5%, a difference of 0.22%).
| Demographics | Rating | Rank | Unemployment Among Ages 35 to 44 years |
| Sri Lankans | 86.8 /100 | #122 | Excellent 4.5% |
| Basques | 86.3 /100 | #123 | Excellent 4.5% |
| Immigrants | Spain | 86.1 /100 | #124 | Excellent 4.5% |
| Immigrants | Northern Africa | 86.1 /100 | #125 | Excellent 4.5% |
| Immigrants | Austria | 84.7 /100 | #126 | Excellent 4.5% |
| Immigrants | Ethiopia | 84.7 /100 | #127 | Excellent 4.5% |
| Czechoslovakians | 83.4 /100 | #128 | Excellent 4.6% |
| Immigrants | Croatia | 83.1 /100 | #129 | Excellent 4.6% |
| Immigrants | Eritrea | 82.8 /100 | #130 | Excellent 4.6% |
| Immigrants | Colombia | 82.6 /100 | #131 | Excellent 4.6% |
| Colombians | 80.8 /100 | #132 | Excellent 4.6% |
| Syrians | 80.7 /100 | #133 | Excellent 4.6% |
| Laotians | 80.1 /100 | #134 | Excellent 4.6% |
| Immigrants | Europe | 79.4 /100 | #135 | Good 4.6% |
| Scotch-Irish | 79.3 /100 | #136 | Good 4.6% |