Cree vs Turkish Median Household Income
COMPARE
Cree
Turkish
Median Household Income
Median Household Income Comparison
Cree
Turks
$74,685
MEDIAN HOUSEHOLD INCOME
0.1/ 100
METRIC RATING
283rd/ 347
METRIC RANK
$99,389
MEDIAN HOUSEHOLD INCOME
100.0/ 100
METRIC RATING
31st/ 347
METRIC RANK
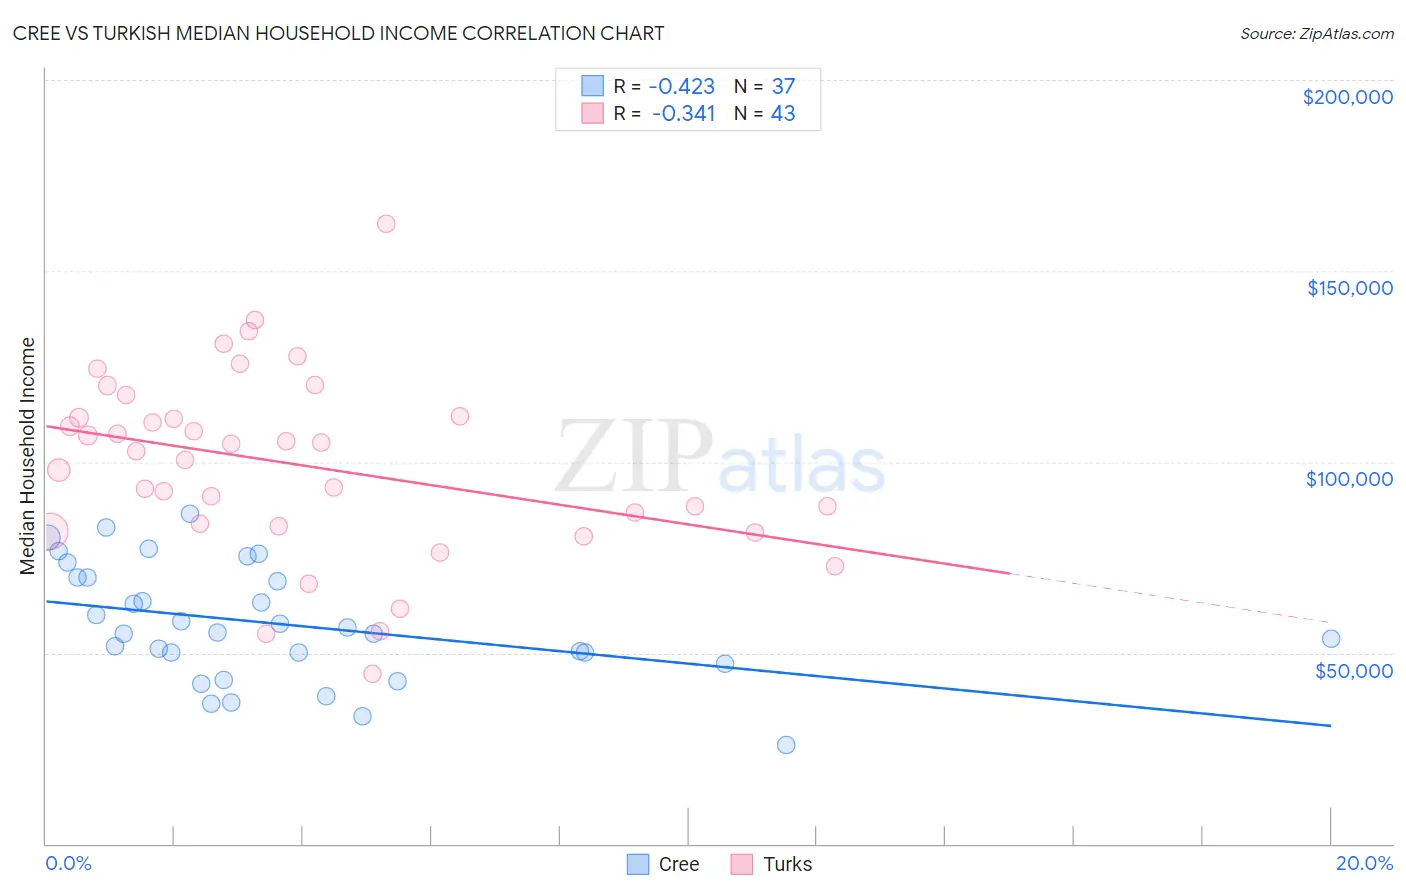
Cree vs Turkish Median Household Income Correlation Chart
The statistical analysis conducted on geographies consisting of 76,206,119 people shows a moderate negative correlation between the proportion of Cree and median household income in the United States with a correlation coefficient (R) of -0.423 and weighted average of $74,685. Similarly, the statistical analysis conducted on geographies consisting of 271,658,597 people shows a mild negative correlation between the proportion of Turks and median household income in the United States with a correlation coefficient (R) of -0.341 and weighted average of $99,389, a difference of 33.1%.
Median Household Income Correlation Summary
| Measurement | Cree | Turkish |
| Minimum | $25,833 | $44,531 |
| Maximum | $86,509 | $162,391 |
| Range | $60,676 | $117,860 |
| Mean | $57,468 | $99,338 |
| Median | $55,368 | $102,665 |
| Interquartile 25% (IQ1) | $48,609 | $83,043 |
| Interquartile 75% (IQ3) | $69,690 | $112,097 |
| Interquartile Range (IQR) | $21,081 | $29,054 |
| Standard Deviation (Sample) | $14,992 | $24,163 |
| Standard Deviation (Population) | $14,788 | $23,880 |
Similar Demographics by Median Household Income
Demographics Similar to Cree by Median Household Income
In terms of median household income, the demographic groups most similar to Cree are Yaqui ($74,596, a difference of 0.12%), Central American Indian ($74,847, a difference of 0.22%), Immigrants from Liberia ($74,896, a difference of 0.28%), Mexican ($74,399, a difference of 0.39%), and Senegalese ($74,999, a difference of 0.42%).
| Demographics | Rating | Rank | Median Household Income |
| Immigrants | Latin America | 0.2 /100 | #276 | Tragic $75,420 |
| Spanish Americans | 0.2 /100 | #277 | Tragic $75,386 |
| Osage | 0.2 /100 | #278 | Tragic $75,240 |
| Immigrants | Guatemala | 0.2 /100 | #279 | Tragic $75,123 |
| Senegalese | 0.2 /100 | #280 | Tragic $74,999 |
| Immigrants | Liberia | 0.1 /100 | #281 | Tragic $74,896 |
| Central American Indians | 0.1 /100 | #282 | Tragic $74,847 |
| Cree | 0.1 /100 | #283 | Tragic $74,685 |
| Yaqui | 0.1 /100 | #284 | Tragic $74,596 |
| Mexicans | 0.1 /100 | #285 | Tragic $74,399 |
| Immigrants | Somalia | 0.1 /100 | #286 | Tragic $74,300 |
| Iroquois | 0.1 /100 | #287 | Tragic $74,279 |
| Immigrants | Central America | 0.1 /100 | #288 | Tragic $74,217 |
| Fijians | 0.1 /100 | #289 | Tragic $74,205 |
| Bangladeshis | 0.1 /100 | #290 | Tragic $74,112 |
Demographics Similar to Turks by Median Household Income
In terms of median household income, the demographic groups most similar to Turks are Immigrants from Northern Europe ($99,813, a difference of 0.43%), Immigrants from Asia ($99,933, a difference of 0.55%), Immigrants from Sri Lanka ($99,943, a difference of 0.56%), Bhutanese ($100,151, a difference of 0.77%), and Immigrants from Denmark ($98,510, a difference of 0.89%).
| Demographics | Rating | Rank | Median Household Income |
| Immigrants | Japan | 100.0 /100 | #24 | Exceptional $100,711 |
| Immigrants | Sweden | 100.0 /100 | #25 | Exceptional $100,699 |
| Immigrants | Belgium | 100.0 /100 | #26 | Exceptional $100,306 |
| Bhutanese | 100.0 /100 | #27 | Exceptional $100,151 |
| Immigrants | Sri Lanka | 100.0 /100 | #28 | Exceptional $99,943 |
| Immigrants | Asia | 100.0 /100 | #29 | Exceptional $99,933 |
| Immigrants | Northern Europe | 100.0 /100 | #30 | Exceptional $99,813 |
| Turks | 100.0 /100 | #31 | Exceptional $99,389 |
| Immigrants | Denmark | 100.0 /100 | #32 | Exceptional $98,510 |
| Chinese | 100.0 /100 | #33 | Exceptional $98,496 |
| Russians | 100.0 /100 | #34 | Exceptional $98,008 |
| Immigrants | Switzerland | 100.0 /100 | #35 | Exceptional $97,979 |
| Immigrants | Pakistan | 100.0 /100 | #36 | Exceptional $97,528 |
| Latvians | 100.0 /100 | #37 | Exceptional $97,311 |
| Immigrants | Indonesia | 100.0 /100 | #38 | Exceptional $97,297 |