Cree vs Immigrants from Kenya Median Household Income
COMPARE
Cree
Immigrants from Kenya
Median Household Income
Median Household Income Comparison
Cree
Immigrants from Kenya
$74,685
MEDIAN HOUSEHOLD INCOME
0.1/ 100
METRIC RATING
283rd/ 347
METRIC RANK
$83,068
MEDIAN HOUSEHOLD INCOME
21.3/ 100
METRIC RATING
206th/ 347
METRIC RANK
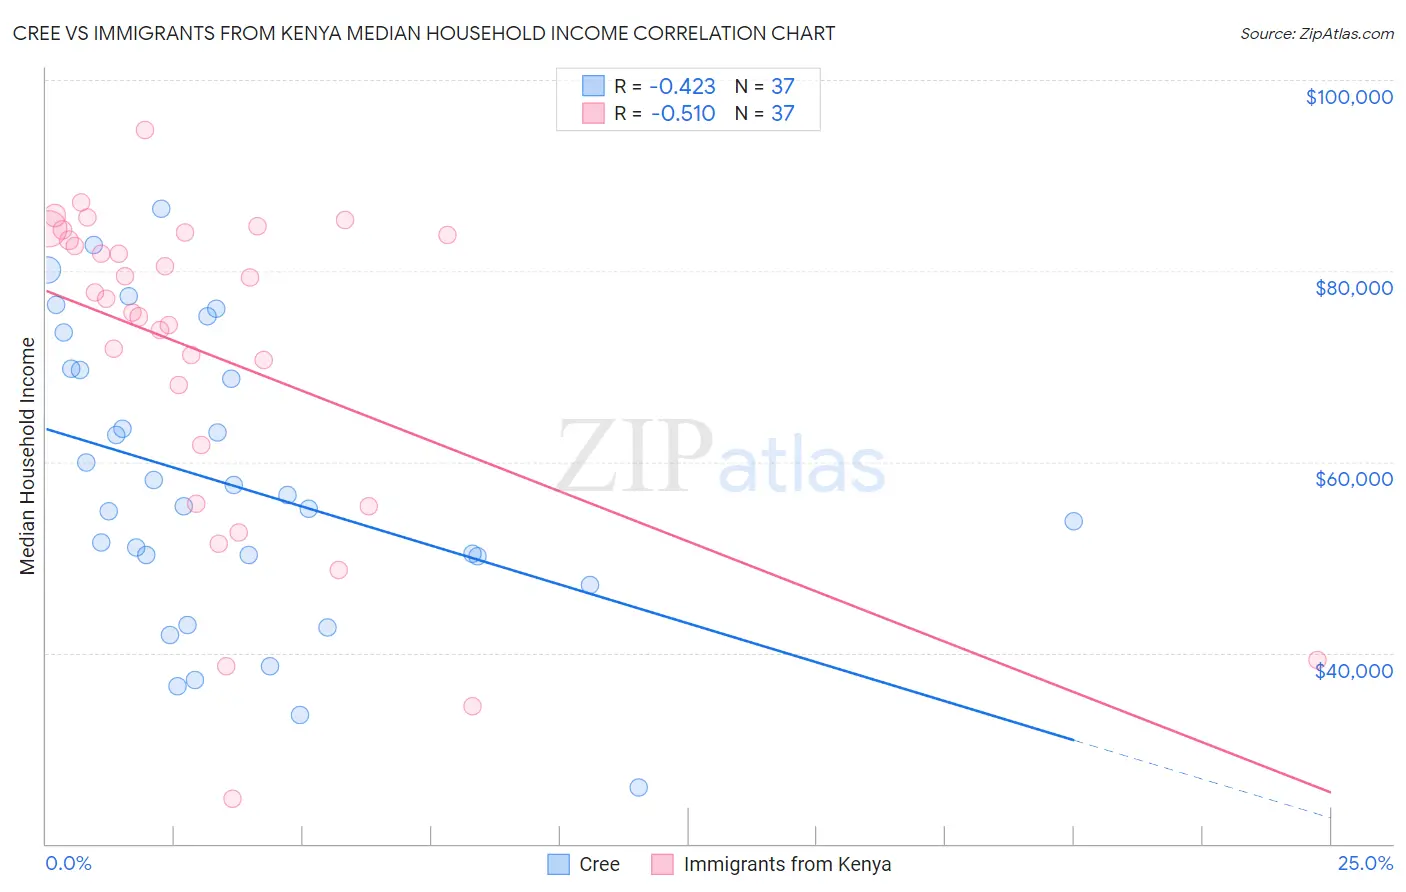
Cree vs Immigrants from Kenya Median Household Income Correlation Chart
The statistical analysis conducted on geographies consisting of 76,206,119 people shows a moderate negative correlation between the proportion of Cree and median household income in the United States with a correlation coefficient (R) of -0.423 and weighted average of $74,685. Similarly, the statistical analysis conducted on geographies consisting of 217,959,858 people shows a substantial negative correlation between the proportion of Immigrants from Kenya and median household income in the United States with a correlation coefficient (R) of -0.510 and weighted average of $83,068, a difference of 11.2%.
Median Household Income Correlation Summary
| Measurement | Cree | Immigrants from Kenya |
| Minimum | $25,833 | $24,660 |
| Maximum | $86,509 | $94,729 |
| Range | $60,676 | $70,069 |
| Mean | $57,468 | $70,990 |
| Median | $55,368 | $77,036 |
| Interquartile 25% (IQ1) | $48,609 | $58,646 |
| Interquartile 75% (IQ3) | $69,690 | $83,895 |
| Interquartile Range (IQR) | $21,081 | $25,249 |
| Standard Deviation (Sample) | $14,992 | $17,137 |
| Standard Deviation (Population) | $14,788 | $16,903 |
Similar Demographics by Median Household Income
Demographics Similar to Cree by Median Household Income
In terms of median household income, the demographic groups most similar to Cree are Yaqui ($74,596, a difference of 0.12%), Central American Indian ($74,847, a difference of 0.22%), Immigrants from Liberia ($74,896, a difference of 0.28%), Mexican ($74,399, a difference of 0.39%), and Senegalese ($74,999, a difference of 0.42%).
| Demographics | Rating | Rank | Median Household Income |
| Immigrants | Latin America | 0.2 /100 | #276 | Tragic $75,420 |
| Spanish Americans | 0.2 /100 | #277 | Tragic $75,386 |
| Osage | 0.2 /100 | #278 | Tragic $75,240 |
| Immigrants | Guatemala | 0.2 /100 | #279 | Tragic $75,123 |
| Senegalese | 0.2 /100 | #280 | Tragic $74,999 |
| Immigrants | Liberia | 0.1 /100 | #281 | Tragic $74,896 |
| Central American Indians | 0.1 /100 | #282 | Tragic $74,847 |
| Cree | 0.1 /100 | #283 | Tragic $74,685 |
| Yaqui | 0.1 /100 | #284 | Tragic $74,596 |
| Mexicans | 0.1 /100 | #285 | Tragic $74,399 |
| Immigrants | Somalia | 0.1 /100 | #286 | Tragic $74,300 |
| Iroquois | 0.1 /100 | #287 | Tragic $74,279 |
| Immigrants | Central America | 0.1 /100 | #288 | Tragic $74,217 |
| Fijians | 0.1 /100 | #289 | Tragic $74,205 |
| Bangladeshis | 0.1 /100 | #290 | Tragic $74,112 |
Demographics Similar to Immigrants from Kenya by Median Household Income
In terms of median household income, the demographic groups most similar to Immigrants from Kenya are Dutch ($82,971, a difference of 0.12%), Celtic ($83,193, a difference of 0.15%), Immigrants from Africa ($83,289, a difference of 0.27%), Immigrants from Cambodia ($83,304, a difference of 0.28%), and Immigrants from Thailand ($83,327, a difference of 0.31%).
| Demographics | Rating | Rank | Median Household Income |
| Germans | 24.6 /100 | #199 | Fair $83,358 |
| Tsimshian | 24.5 /100 | #200 | Fair $83,346 |
| Spanish | 24.4 /100 | #201 | Fair $83,343 |
| Immigrants | Thailand | 24.3 /100 | #202 | Fair $83,327 |
| Immigrants | Cambodia | 24.0 /100 | #203 | Fair $83,304 |
| Immigrants | Africa | 23.8 /100 | #204 | Fair $83,289 |
| Celtics | 22.7 /100 | #205 | Fair $83,193 |
| Immigrants | Kenya | 21.3 /100 | #206 | Fair $83,068 |
| Dutch | 20.3 /100 | #207 | Fair $82,971 |
| French Canadians | 18.7 /100 | #208 | Poor $82,810 |
| Immigrants | Iraq | 16.7 /100 | #209 | Poor $82,594 |
| Immigrants | Uruguay | 16.4 /100 | #210 | Poor $82,560 |
| Salvadorans | 15.4 /100 | #211 | Poor $82,449 |
| Venezuelans | 15.3 /100 | #212 | Poor $82,432 |
| Nepalese | 15.1 /100 | #213 | Poor $82,410 |