Cree vs Assyrian/Chaldean/Syriac Median Household Income
COMPARE
Cree
Assyrian/Chaldean/Syriac
Median Household Income
Median Household Income Comparison
Cree
Assyrians/Chaldeans/Syriacs
$74,685
MEDIAN HOUSEHOLD INCOME
0.1/ 100
METRIC RATING
283rd/ 347
METRIC RANK
$91,991
MEDIAN HOUSEHOLD INCOME
98.8/ 100
METRIC RATING
90th/ 347
METRIC RANK
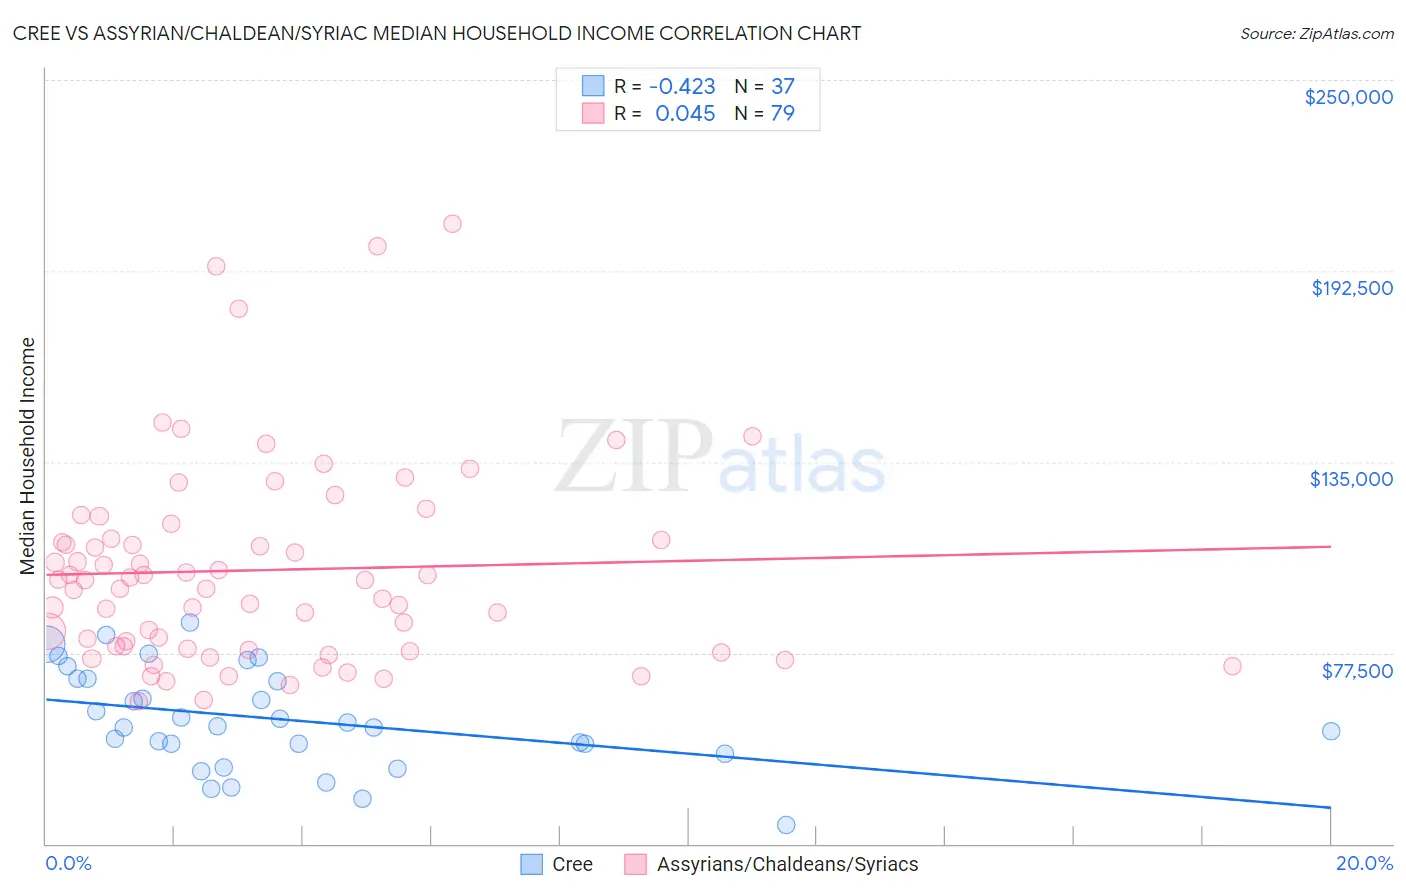
Cree vs Assyrian/Chaldean/Syriac Median Household Income Correlation Chart
The statistical analysis conducted on geographies consisting of 76,206,119 people shows a moderate negative correlation between the proportion of Cree and median household income in the United States with a correlation coefficient (R) of -0.423 and weighted average of $74,685. Similarly, the statistical analysis conducted on geographies consisting of 110,256,349 people shows no correlation between the proportion of Assyrians/Chaldeans/Syriacs and median household income in the United States with a correlation coefficient (R) of 0.045 and weighted average of $91,991, a difference of 23.2%.
Median Household Income Correlation Summary
| Measurement | Cree | Assyrian/Chaldean/Syriac |
| Minimum | $25,833 | $63,036 |
| Maximum | $86,509 | $206,750 |
| Range | $60,676 | $143,714 |
| Mean | $57,468 | $102,405 |
| Median | $55,368 | $99,390 |
| Interquartile 25% (IQ1) | $48,609 | $78,587 |
| Interquartile 75% (IQ3) | $69,690 | $111,848 |
| Interquartile Range (IQR) | $21,081 | $33,262 |
| Standard Deviation (Sample) | $14,992 | $30,418 |
| Standard Deviation (Population) | $14,788 | $30,225 |
Similar Demographics by Median Household Income
Demographics Similar to Cree by Median Household Income
In terms of median household income, the demographic groups most similar to Cree are Yaqui ($74,596, a difference of 0.12%), Central American Indian ($74,847, a difference of 0.22%), Immigrants from Liberia ($74,896, a difference of 0.28%), Mexican ($74,399, a difference of 0.39%), and Senegalese ($74,999, a difference of 0.42%).
| Demographics | Rating | Rank | Median Household Income |
| Immigrants | Latin America | 0.2 /100 | #276 | Tragic $75,420 |
| Spanish Americans | 0.2 /100 | #277 | Tragic $75,386 |
| Osage | 0.2 /100 | #278 | Tragic $75,240 |
| Immigrants | Guatemala | 0.2 /100 | #279 | Tragic $75,123 |
| Senegalese | 0.2 /100 | #280 | Tragic $74,999 |
| Immigrants | Liberia | 0.1 /100 | #281 | Tragic $74,896 |
| Central American Indians | 0.1 /100 | #282 | Tragic $74,847 |
| Cree | 0.1 /100 | #283 | Tragic $74,685 |
| Yaqui | 0.1 /100 | #284 | Tragic $74,596 |
| Mexicans | 0.1 /100 | #285 | Tragic $74,399 |
| Immigrants | Somalia | 0.1 /100 | #286 | Tragic $74,300 |
| Iroquois | 0.1 /100 | #287 | Tragic $74,279 |
| Immigrants | Central America | 0.1 /100 | #288 | Tragic $74,217 |
| Fijians | 0.1 /100 | #289 | Tragic $74,205 |
| Bangladeshis | 0.1 /100 | #290 | Tragic $74,112 |
Demographics Similar to Assyrians/Chaldeans/Syriacs by Median Household Income
In terms of median household income, the demographic groups most similar to Assyrians/Chaldeans/Syriacs are Romanian ($91,994, a difference of 0.0%), Immigrants from Vietnam ($91,987, a difference of 0.0%), Immigrants from Canada ($92,029, a difference of 0.040%), Immigrants from Western Europe ($91,936, a difference of 0.060%), and Immigrants from Hungary ($92,094, a difference of 0.11%).
| Demographics | Rating | Rank | Median Household Income |
| Italians | 99.1 /100 | #83 | Exceptional $92,475 |
| Immigrants | Argentina | 99.1 /100 | #84 | Exceptional $92,417 |
| Immigrants | Croatia | 99.0 /100 | #85 | Exceptional $92,225 |
| Immigrants | England | 98.9 /100 | #86 | Exceptional $92,098 |
| Immigrants | Hungary | 98.9 /100 | #87 | Exceptional $92,094 |
| Immigrants | Canada | 98.8 /100 | #88 | Exceptional $92,029 |
| Romanians | 98.8 /100 | #89 | Exceptional $91,994 |
| Assyrians/Chaldeans/Syriacs | 98.8 /100 | #90 | Exceptional $91,991 |
| Immigrants | Vietnam | 98.8 /100 | #91 | Exceptional $91,987 |
| Immigrants | Western Europe | 98.8 /100 | #92 | Exceptional $91,936 |
| Immigrants | Lebanon | 98.7 /100 | #93 | Exceptional $91,887 |
| Immigrants | North America | 98.7 /100 | #94 | Exceptional $91,860 |
| Armenians | 98.7 /100 | #95 | Exceptional $91,807 |
| Jordanians | 98.7 /100 | #96 | Exceptional $91,794 |
| Immigrants | Serbia | 98.6 /100 | #97 | Exceptional $91,730 |