Cree vs Immigrants from Portugal Median Household Income
COMPARE
Cree
Immigrants from Portugal
Median Household Income
Median Household Income Comparison
Cree
Immigrants from Portugal
$74,685
MEDIAN HOUSEHOLD INCOME
0.1/ 100
METRIC RATING
283rd/ 347
METRIC RANK
$84,740
MEDIAN HOUSEHOLD INCOME
44.2/ 100
METRIC RATING
180th/ 347
METRIC RANK
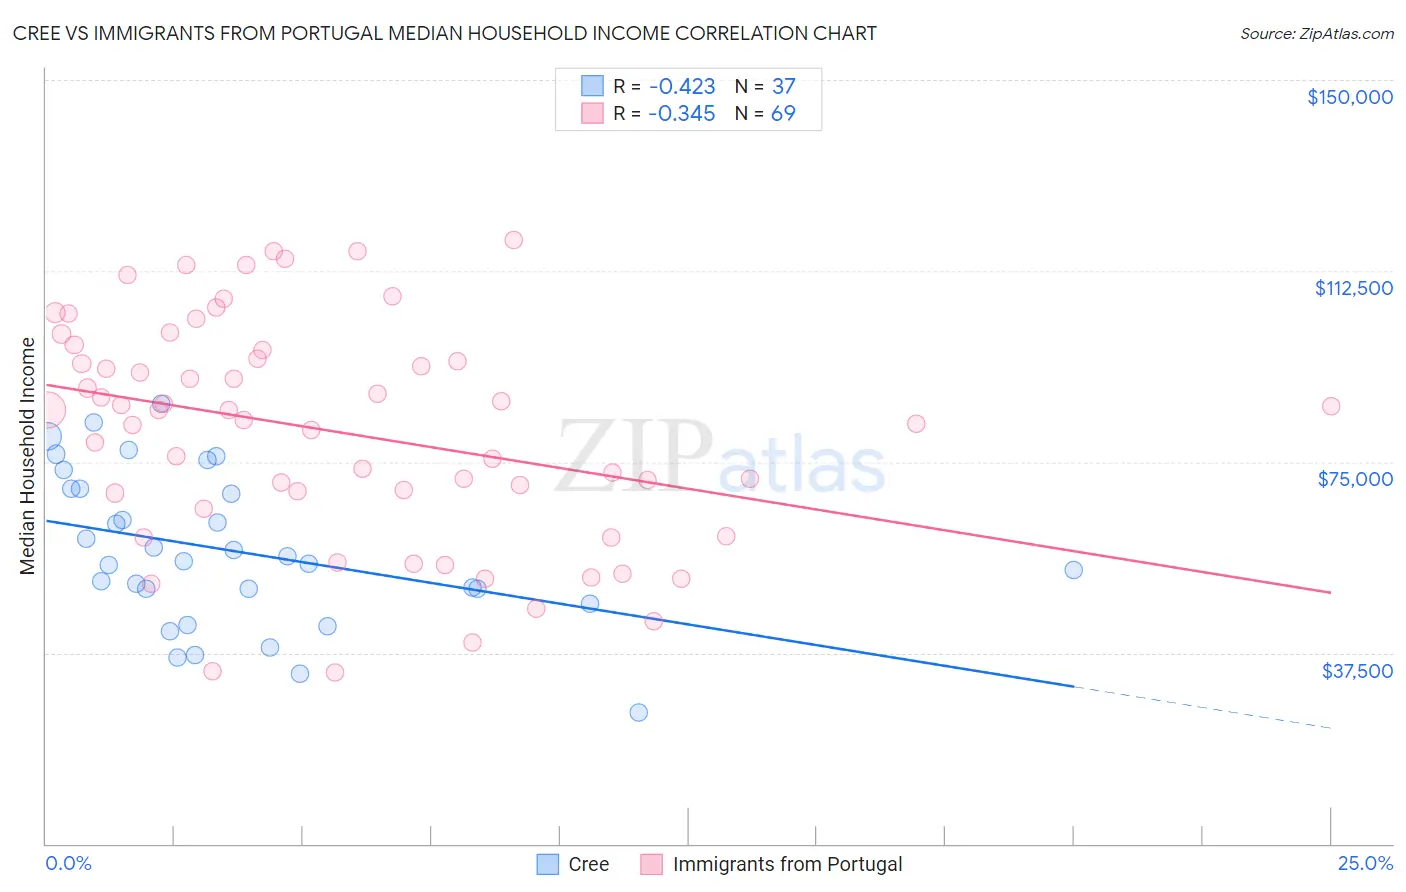
Cree vs Immigrants from Portugal Median Household Income Correlation Chart
The statistical analysis conducted on geographies consisting of 76,206,119 people shows a moderate negative correlation between the proportion of Cree and median household income in the United States with a correlation coefficient (R) of -0.423 and weighted average of $74,685. Similarly, the statistical analysis conducted on geographies consisting of 174,758,543 people shows a mild negative correlation between the proportion of Immigrants from Portugal and median household income in the United States with a correlation coefficient (R) of -0.345 and weighted average of $84,740, a difference of 13.5%.
Median Household Income Correlation Summary
| Measurement | Cree | Immigrants from Portugal |
| Minimum | $25,833 | $33,750 |
| Maximum | $86,509 | $118,667 |
| Range | $60,676 | $84,917 |
| Mean | $57,468 | $80,926 |
| Median | $55,368 | $85,116 |
| Interquartile 25% (IQ1) | $48,609 | $67,289 |
| Interquartile 75% (IQ3) | $69,690 | $96,142 |
| Interquartile Range (IQR) | $21,081 | $28,853 |
| Standard Deviation (Sample) | $14,992 | $21,750 |
| Standard Deviation (Population) | $14,788 | $21,592 |
Similar Demographics by Median Household Income
Demographics Similar to Cree by Median Household Income
In terms of median household income, the demographic groups most similar to Cree are Yaqui ($74,596, a difference of 0.12%), Central American Indian ($74,847, a difference of 0.22%), Immigrants from Liberia ($74,896, a difference of 0.28%), Mexican ($74,399, a difference of 0.39%), and Senegalese ($74,999, a difference of 0.42%).
| Demographics | Rating | Rank | Median Household Income |
| Immigrants | Latin America | 0.2 /100 | #276 | Tragic $75,420 |
| Spanish Americans | 0.2 /100 | #277 | Tragic $75,386 |
| Osage | 0.2 /100 | #278 | Tragic $75,240 |
| Immigrants | Guatemala | 0.2 /100 | #279 | Tragic $75,123 |
| Senegalese | 0.2 /100 | #280 | Tragic $74,999 |
| Immigrants | Liberia | 0.1 /100 | #281 | Tragic $74,896 |
| Central American Indians | 0.1 /100 | #282 | Tragic $74,847 |
| Cree | 0.1 /100 | #283 | Tragic $74,685 |
| Yaqui | 0.1 /100 | #284 | Tragic $74,596 |
| Mexicans | 0.1 /100 | #285 | Tragic $74,399 |
| Immigrants | Somalia | 0.1 /100 | #286 | Tragic $74,300 |
| Iroquois | 0.1 /100 | #287 | Tragic $74,279 |
| Immigrants | Central America | 0.1 /100 | #288 | Tragic $74,217 |
| Fijians | 0.1 /100 | #289 | Tragic $74,205 |
| Bangladeshis | 0.1 /100 | #290 | Tragic $74,112 |
Demographics Similar to Immigrants from Portugal by Median Household Income
In terms of median household income, the demographic groups most similar to Immigrants from Portugal are Hawaiian ($84,729, a difference of 0.010%), Uruguayan ($84,691, a difference of 0.060%), Spaniard ($84,644, a difference of 0.11%), English ($84,915, a difference of 0.21%), and Czechoslovakian ($84,965, a difference of 0.27%).
| Demographics | Rating | Rank | Median Household Income |
| Immigrants | Cameroon | 53.4 /100 | #173 | Average $85,314 |
| Scottish | 50.0 /100 | #174 | Average $85,101 |
| Immigrants | Costa Rica | 49.2 /100 | #175 | Average $85,054 |
| Alsatians | 49.2 /100 | #176 | Average $85,053 |
| Immigrants | Eritrea | 48.8 /100 | #177 | Average $85,025 |
| Czechoslovakians | 47.8 /100 | #178 | Average $84,965 |
| English | 47.0 /100 | #179 | Average $84,915 |
| Immigrants | Portugal | 44.2 /100 | #180 | Average $84,740 |
| Hawaiians | 44.1 /100 | #181 | Average $84,729 |
| Uruguayans | 43.5 /100 | #182 | Average $84,691 |
| Spaniards | 42.7 /100 | #183 | Average $84,644 |
| Immigrants | Eastern Africa | 37.4 /100 | #184 | Fair $84,299 |
| Kenyans | 34.2 /100 | #185 | Fair $84,085 |
| Puget Sound Salish | 33.2 /100 | #186 | Fair $84,011 |
| Belgians | 33.2 /100 | #187 | Fair $84,008 |