Cree vs Immigrants from Afghanistan Per Capita Income
COMPARE
Cree
Immigrants from Afghanistan
Per Capita Income
Per Capita Income Comparison
Cree
Immigrants from Afghanistan
$40,056
PER CAPITA INCOME
1.7/ 100
METRIC RATING
246th/ 347
METRIC RANK
$44,790
PER CAPITA INCOME
78.0/ 100
METRIC RATING
145th/ 347
METRIC RANK
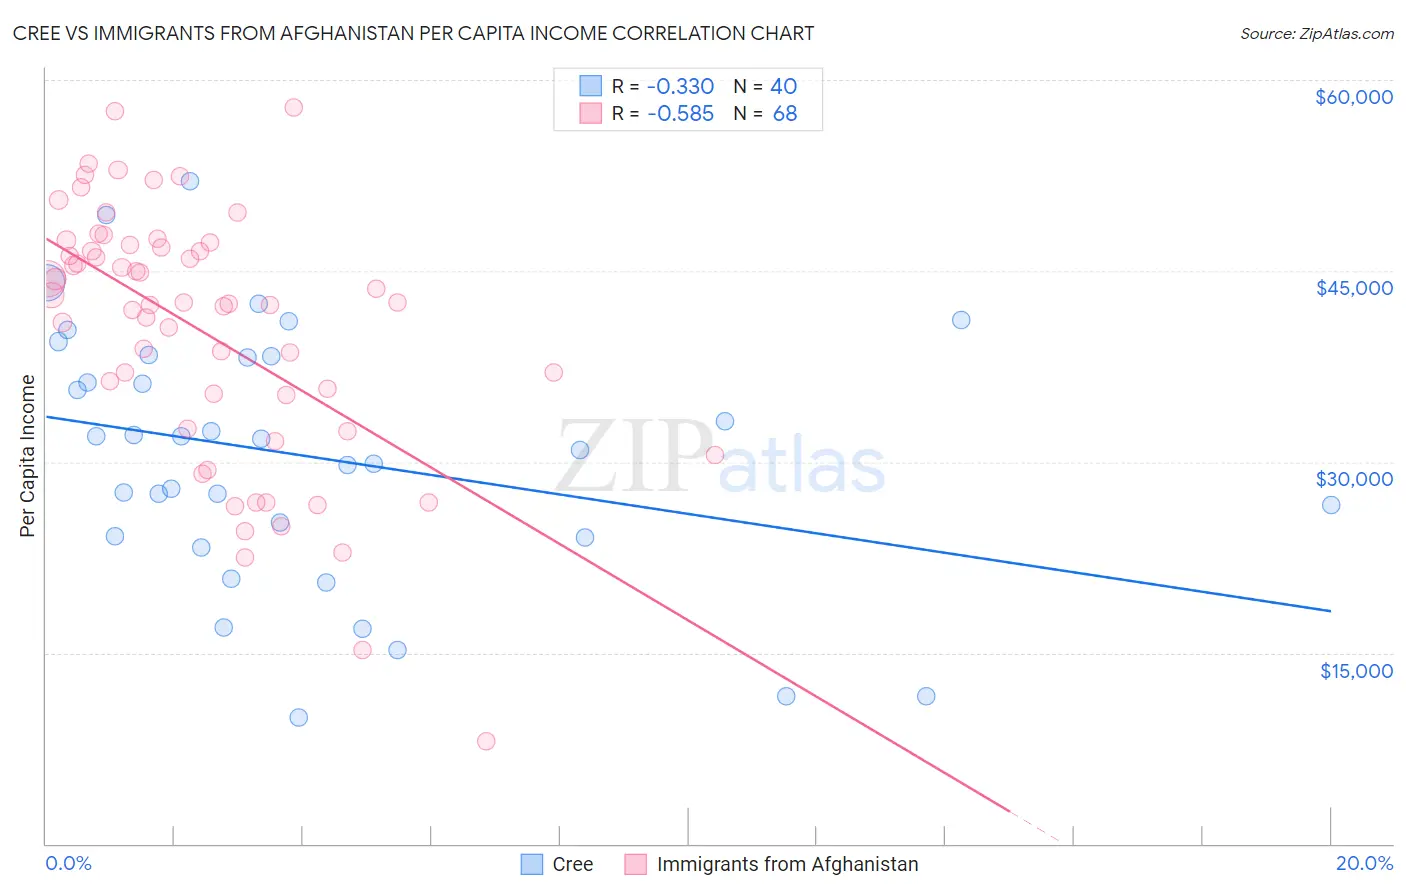
Cree vs Immigrants from Afghanistan Per Capita Income Correlation Chart
The statistical analysis conducted on geographies consisting of 76,211,685 people shows a mild negative correlation between the proportion of Cree and per capita income in the United States with a correlation coefficient (R) of -0.330 and weighted average of $40,056. Similarly, the statistical analysis conducted on geographies consisting of 147,645,791 people shows a substantial negative correlation between the proportion of Immigrants from Afghanistan and per capita income in the United States with a correlation coefficient (R) of -0.585 and weighted average of $44,790, a difference of 11.8%.
Per Capita Income Correlation Summary
| Measurement | Cree | Immigrants from Afghanistan |
| Minimum | $9,879 | $8,026 |
| Maximum | $52,079 | $57,850 |
| Range | $42,200 | $49,824 |
| Mean | $30,350 | $40,206 |
| Median | $31,398 | $42,427 |
| Interquartile 25% (IQ1) | $24,114 | $33,957 |
| Interquartile 75% (IQ3) | $38,235 | $46,949 |
| Interquartile Range (IQR) | $14,121 | $12,992 |
| Standard Deviation (Sample) | $10,115 | $10,126 |
| Standard Deviation (Population) | $9,988 | $10,052 |
Similar Demographics by Per Capita Income
Demographics Similar to Cree by Per Capita Income
In terms of per capita income, the demographic groups most similar to Cree are Immigrants from Somalia ($39,974, a difference of 0.20%), Subsaharan African ($40,152, a difference of 0.24%), Cape Verdean ($39,935, a difference of 0.30%), Japanese ($39,870, a difference of 0.46%), and French American Indian ($40,244, a difference of 0.47%).
| Demographics | Rating | Rank | Per Capita Income |
| Tsimshian | 2.4 /100 | #239 | Tragic $40,344 |
| Immigrants | Nigeria | 2.3 /100 | #240 | Tragic $40,339 |
| British West Indians | 2.3 /100 | #241 | Tragic $40,330 |
| Immigrants | Western Africa | 2.2 /100 | #242 | Tragic $40,294 |
| German Russians | 2.2 /100 | #243 | Tragic $40,266 |
| French American Indians | 2.1 /100 | #244 | Tragic $40,244 |
| Sub-Saharan Africans | 1.9 /100 | #245 | Tragic $40,152 |
| Cree | 1.7 /100 | #246 | Tragic $40,056 |
| Immigrants | Somalia | 1.6 /100 | #247 | Tragic $39,974 |
| Cape Verdeans | 1.5 /100 | #248 | Tragic $39,935 |
| Japanese | 1.4 /100 | #249 | Tragic $39,870 |
| Immigrants | Burma/Myanmar | 1.3 /100 | #250 | Tragic $39,827 |
| Samoans | 1.3 /100 | #251 | Tragic $39,826 |
| Immigrants | Azores | 1.0 /100 | #252 | Tragic $39,608 |
| Osage | 1.0 /100 | #253 | Tragic $39,568 |
Demographics Similar to Immigrants from Afghanistan by Per Capita Income
In terms of per capita income, the demographic groups most similar to Immigrants from Afghanistan are Irish ($44,679, a difference of 0.25%), Icelander ($44,987, a difference of 0.44%), Czech ($44,595, a difference of 0.44%), Immigrants from Armenia ($44,552, a difference of 0.53%), and Immigrants from Uganda ($45,043, a difference of 0.56%).
| Demographics | Rating | Rank | Per Capita Income |
| Assyrians/Chaldeans/Syriacs | 84.8 /100 | #138 | Excellent $45,195 |
| Basques | 83.2 /100 | #139 | Excellent $45,086 |
| Immigrants | Jordan | 82.9 /100 | #140 | Excellent $45,066 |
| Slavs | 82.6 /100 | #141 | Excellent $45,049 |
| Ugandans | 82.6 /100 | #142 | Excellent $45,047 |
| Immigrants | Uganda | 82.5 /100 | #143 | Excellent $45,043 |
| Icelanders | 81.6 /100 | #144 | Excellent $44,987 |
| Immigrants | Afghanistan | 78.0 /100 | #145 | Good $44,790 |
| Irish | 75.8 /100 | #146 | Good $44,679 |
| Czechs | 74.1 /100 | #147 | Good $44,595 |
| Immigrants | Armenia | 73.1 /100 | #148 | Good $44,552 |
| Koreans | 72.5 /100 | #149 | Good $44,522 |
| Immigrants | Eritrea | 72.1 /100 | #150 | Good $44,509 |
| Norwegians | 71.5 /100 | #151 | Good $44,480 |
| Peruvians | 71.5 /100 | #152 | Good $44,479 |