Ute vs Immigrants from Cabo Verde Median Family Income
COMPARE
Ute
Immigrants from Cabo Verde
Median Family Income
Median Family Income Comparison
Ute
Immigrants from Cabo Verde
$87,596
MEDIAN FAMILY INCOME
0.0/ 100
METRIC RATING
293rd/ 347
METRIC RANK
$87,830
MEDIAN FAMILY INCOME
0.1/ 100
METRIC RATING
291st/ 347
METRIC RANK
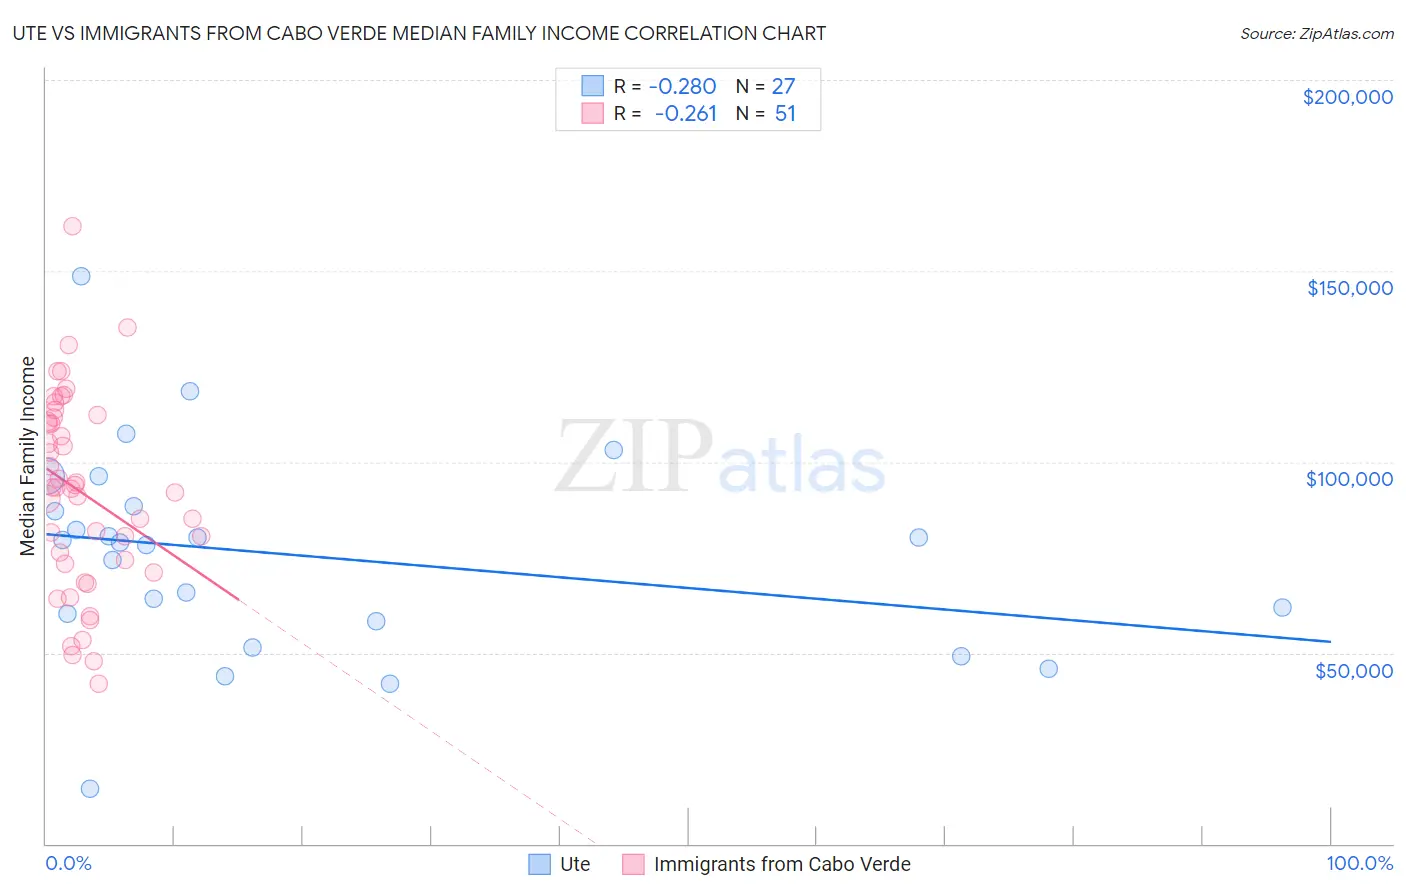
Ute vs Immigrants from Cabo Verde Median Family Income Correlation Chart
The statistical analysis conducted on geographies consisting of 55,656,168 people shows a weak negative correlation between the proportion of Ute and median family income in the United States with a correlation coefficient (R) of -0.280 and weighted average of $87,596. Similarly, the statistical analysis conducted on geographies consisting of 38,130,720 people shows a weak negative correlation between the proportion of Immigrants from Cabo Verde and median family income in the United States with a correlation coefficient (R) of -0.261 and weighted average of $87,830, a difference of 0.27%.
Median Family Income Correlation Summary
| Measurement | Ute | Immigrants from Cabo Verde |
| Minimum | $14,519 | $41,875 |
| Maximum | $148,724 | $161,685 |
| Range | $134,205 | $119,810 |
| Mean | $75,455 | $92,155 |
| Median | $78,980 | $93,152 |
| Interquartile 25% (IQ1) | $58,333 | $73,200 |
| Interquartile 75% (IQ3) | $88,500 | $111,657 |
| Interquartile Range (IQR) | $30,167 | $38,457 |
| Standard Deviation (Sample) | $27,197 | $25,505 |
| Standard Deviation (Population) | $26,688 | $25,254 |
Demographics Similar to Ute and Immigrants from Cabo Verde by Median Family Income
In terms of median family income, the demographic groups most similar to Ute are Fijian ($87,387, a difference of 0.24%), African ($87,820, a difference of 0.26%), Shoshone ($87,872, a difference of 0.32%), Yaqui ($87,289, a difference of 0.35%), and Immigrants from Guatemala ($87,191, a difference of 0.46%). Similarly, the demographic groups most similar to Immigrants from Cabo Verde are African ($87,820, a difference of 0.010%), Shoshone ($87,872, a difference of 0.050%), Central American Indian ($88,034, a difference of 0.23%), Cherokee ($88,209, a difference of 0.43%), and Potawatomi ($88,265, a difference of 0.49%).
| Demographics | Rating | Rank | Median Family Income |
| Comanche | 0.1 /100 | #282 | Tragic $88,556 |
| Bangladeshis | 0.1 /100 | #283 | Tragic $88,358 |
| Indonesians | 0.1 /100 | #284 | Tragic $88,301 |
| Guatemalans | 0.1 /100 | #285 | Tragic $88,295 |
| Immigrants | Nicaragua | 0.1 /100 | #286 | Tragic $88,267 |
| Potawatomi | 0.1 /100 | #287 | Tragic $88,265 |
| Cherokee | 0.1 /100 | #288 | Tragic $88,209 |
| Central American Indians | 0.1 /100 | #289 | Tragic $88,034 |
| Shoshone | 0.1 /100 | #290 | Tragic $87,872 |
| Immigrants | Cabo Verde | 0.1 /100 | #291 | Tragic $87,830 |
| Africans | 0.1 /100 | #292 | Tragic $87,820 |
| Ute | 0.0 /100 | #293 | Tragic $87,596 |
| Fijians | 0.0 /100 | #294 | Tragic $87,387 |
| Yaqui | 0.0 /100 | #295 | Tragic $87,289 |
| Immigrants | Guatemala | 0.0 /100 | #296 | Tragic $87,191 |
| Cajuns | 0.0 /100 | #297 | Tragic $87,157 |
| Immigrants | Latin America | 0.0 /100 | #298 | Tragic $86,989 |
| Chippewa | 0.0 /100 | #299 | Tragic $86,852 |
| Ottawa | 0.0 /100 | #300 | Tragic $86,380 |
| Colville | 0.0 /100 | #301 | Tragic $85,792 |
| Spanish American Indians | 0.0 /100 | #302 | Tragic $85,728 |