Comanche vs Immigrants from Nigeria 6th Grade
COMPARE
Comanche
Immigrants from Nigeria
6th Grade
6th Grade Comparison
Comanche
Immigrants from Nigeria
97.0%
6TH GRADE
37.9/ 100
METRIC RATING
181st/ 347
METRIC RANK
96.4%
6TH GRADE
0.3/ 100
METRIC RATING
262nd/ 347
METRIC RANK
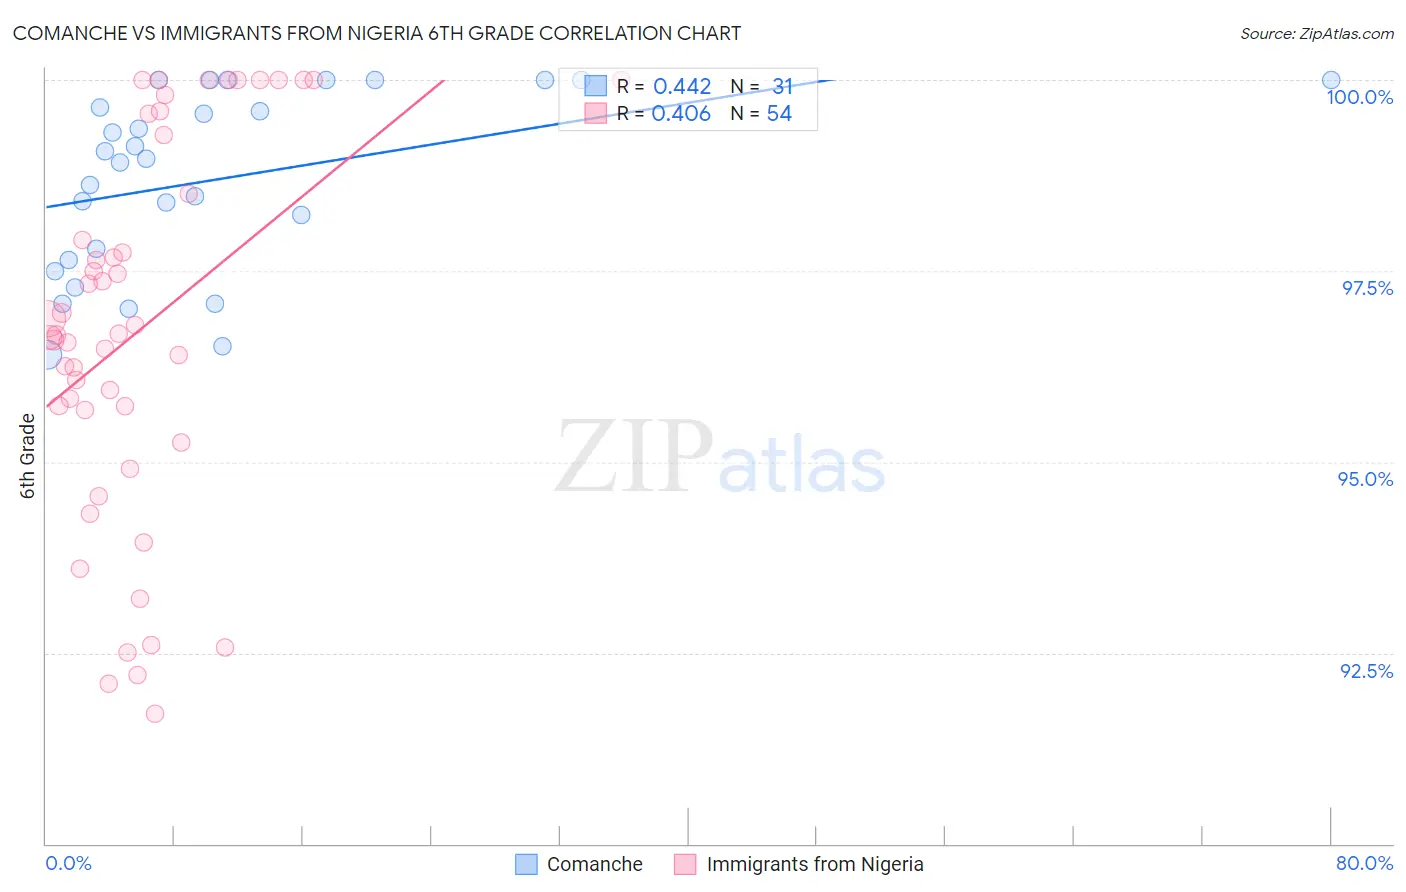
Comanche vs Immigrants from Nigeria 6th Grade Correlation Chart
The statistical analysis conducted on geographies consisting of 109,786,530 people shows a moderate positive correlation between the proportion of Comanche and percentage of population with at least 6th grade education in the United States with a correlation coefficient (R) of 0.442 and weighted average of 97.0%. Similarly, the statistical analysis conducted on geographies consisting of 283,430,369 people shows a moderate positive correlation between the proportion of Immigrants from Nigeria and percentage of population with at least 6th grade education in the United States with a correlation coefficient (R) of 0.406 and weighted average of 96.4%, a difference of 0.62%.
6th Grade Correlation Summary
| Measurement | Comanche | Immigrants from Nigeria |
| Minimum | 96.4% | 91.7% |
| Maximum | 100.0% | 100.0% |
| Range | 3.6% | 8.3% |
| Mean | 98.7% | 96.8% |
| Median | 99.0% | 96.7% |
| Interquartile 25% (IQ1) | 97.6% | 95.7% |
| Interquartile 75% (IQ3) | 100.0% | 99.3% |
| Interquartile Range (IQR) | 2.4% | 3.6% |
| Standard Deviation (Sample) | 1.2% | 2.5% |
| Standard Deviation (Population) | 1.2% | 2.4% |
Similar Demographics by 6th Grade
Demographics Similar to Comanche by 6th Grade
In terms of 6th grade, the demographic groups most similar to Comanche are Immigrants from Spain (97.0%, a difference of 0.010%), Immigrants from Ukraine (97.0%, a difference of 0.010%), Immigrants from Venezuela (97.0%, a difference of 0.020%), Spanish American (97.0%, a difference of 0.020%), and Argentinean (97.0%, a difference of 0.020%).
| Demographics | Rating | Rank | 6th Grade |
| Venezuelans | 50.0 /100 | #174 | Average 97.0% |
| Immigrants | Kazakhstan | 47.3 /100 | #175 | Average 97.0% |
| Immigrants | Micronesia | 47.1 /100 | #176 | Average 97.0% |
| Mongolians | 46.7 /100 | #177 | Average 97.0% |
| Pakistanis | 46.0 /100 | #178 | Average 97.0% |
| Immigrants | Kenya | 45.3 /100 | #179 | Average 97.0% |
| Immigrants | Spain | 39.9 /100 | #180 | Fair 97.0% |
| Comanche | 37.9 /100 | #181 | Fair 97.0% |
| Immigrants | Ukraine | 35.6 /100 | #182 | Fair 97.0% |
| Immigrants | Venezuela | 34.5 /100 | #183 | Fair 97.0% |
| Spanish Americans | 33.5 /100 | #184 | Fair 97.0% |
| Argentineans | 33.0 /100 | #185 | Fair 97.0% |
| Immigrants | Egypt | 31.4 /100 | #186 | Fair 97.0% |
| Guamanians/Chamorros | 30.6 /100 | #187 | Fair 97.0% |
| Immigrants | Argentina | 30.4 /100 | #188 | Fair 97.0% |
Demographics Similar to Immigrants from Nigeria by 6th Grade
In terms of 6th grade, the demographic groups most similar to Immigrants from Nigeria are Immigrants from Colombia (96.4%, a difference of 0.010%), Armenian (96.4%, a difference of 0.020%), Immigrants from Jamaica (96.4%, a difference of 0.020%), Ghanaian (96.4%, a difference of 0.030%), and Afghan (96.4%, a difference of 0.030%).
| Demographics | Rating | Rank | 6th Grade |
| Immigrants | Congo | 0.6 /100 | #255 | Tragic 96.5% |
| U.S. Virgin Islanders | 0.5 /100 | #256 | Tragic 96.5% |
| Taiwanese | 0.5 /100 | #257 | Tragic 96.5% |
| Immigrants | China | 0.4 /100 | #258 | Tragic 96.4% |
| South Americans | 0.4 /100 | #259 | Tragic 96.4% |
| Peruvians | 0.4 /100 | #260 | Tragic 96.4% |
| Immigrants | Sierra Leone | 0.4 /100 | #261 | Tragic 96.4% |
| Immigrants | Nigeria | 0.3 /100 | #262 | Tragic 96.4% |
| Immigrants | Colombia | 0.3 /100 | #263 | Tragic 96.4% |
| Armenians | 0.3 /100 | #264 | Tragic 96.4% |
| Immigrants | Jamaica | 0.2 /100 | #265 | Tragic 96.4% |
| Ghanaians | 0.2 /100 | #266 | Tragic 96.4% |
| Afghans | 0.2 /100 | #267 | Tragic 96.4% |
| Immigrants | Uzbekistan | 0.2 /100 | #268 | Tragic 96.3% |
| West Indians | 0.2 /100 | #269 | Tragic 96.3% |