Nigerian vs Immigrants from Nigeria Median Earnings
COMPARE
Nigerian
Immigrants from Nigeria
Median Earnings
Median Earnings Comparison
Nigerians
Immigrants from Nigeria
$45,532
MEDIAN EARNINGS
22.0/ 100
METRIC RATING
214th/ 347
METRIC RANK
$45,030
MEDIAN EARNINGS
12.2/ 100
METRIC RATING
226th/ 347
METRIC RANK
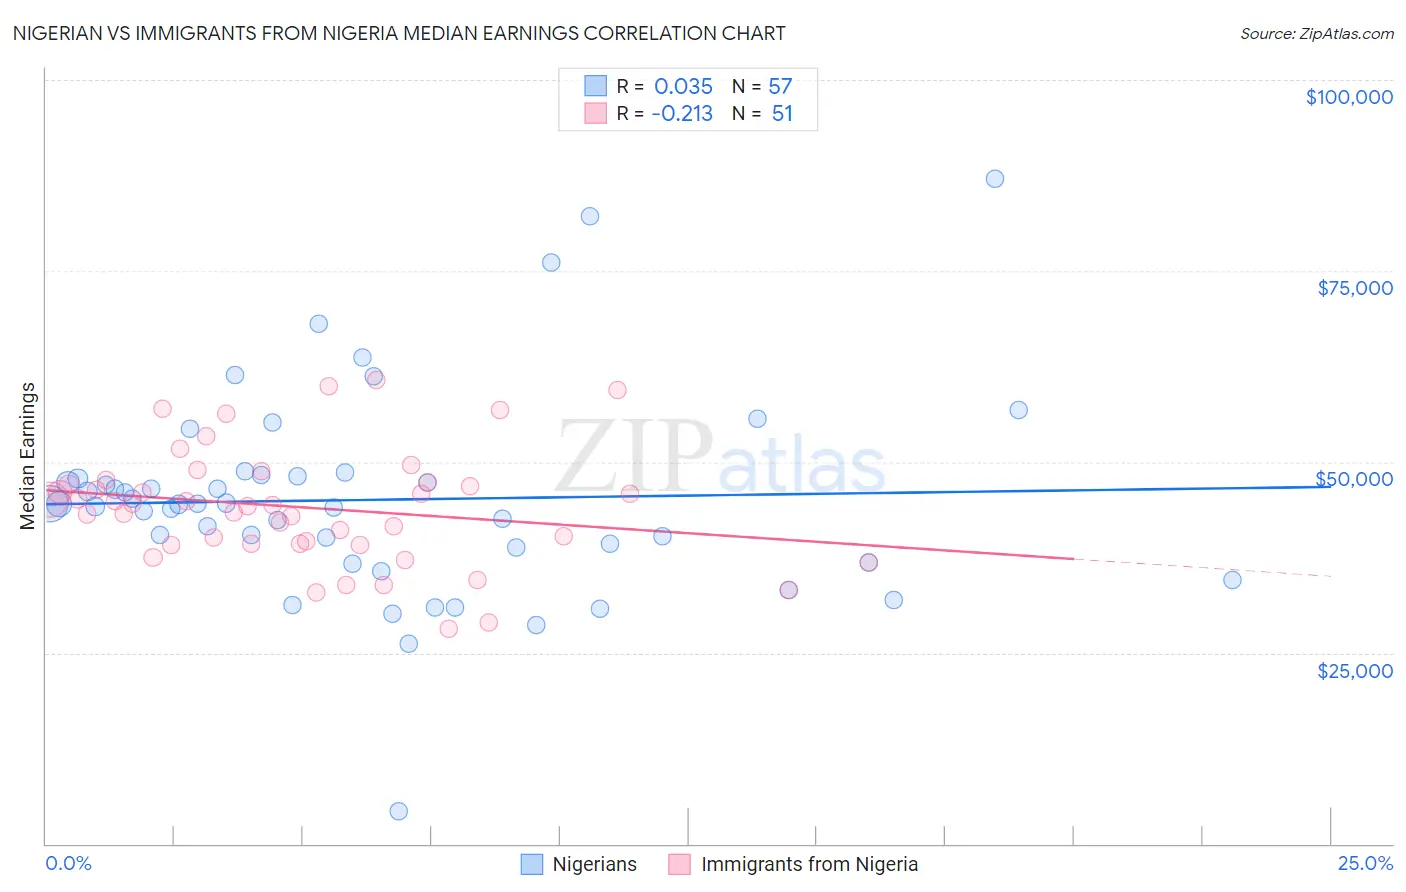
Nigerian vs Immigrants from Nigeria Median Earnings Correlation Chart
The statistical analysis conducted on geographies consisting of 332,779,942 people shows no correlation between the proportion of Nigerians and median earnings in the United States with a correlation coefficient (R) of 0.035 and weighted average of $45,532. Similarly, the statistical analysis conducted on geographies consisting of 283,479,904 people shows a weak negative correlation between the proportion of Immigrants from Nigeria and median earnings in the United States with a correlation coefficient (R) of -0.213 and weighted average of $45,030, a difference of 1.1%.
Median Earnings Correlation Summary
| Measurement | Nigerian | Immigrants from Nigeria |
| Minimum | $4,253 | $28,094 |
| Maximum | $87,061 | $60,652 |
| Range | $82,808 | $32,558 |
| Mean | $45,043 | $44,023 |
| Median | $44,458 | $44,326 |
| Interquartile 25% (IQ1) | $37,816 | $39,209 |
| Interquartile 75% (IQ3) | $48,156 | $47,273 |
| Interquartile Range (IQR) | $10,339 | $8,064 |
| Standard Deviation (Sample) | $13,482 | $7,558 |
| Standard Deviation (Population) | $13,364 | $7,484 |
Demographics Similar to Nigerians and Immigrants from Nigeria by Median Earnings
In terms of median earnings, the demographic groups most similar to Nigerians are Immigrants from Bangladesh ($45,532, a difference of 0.0%), Immigrants from Colombia ($45,550, a difference of 0.040%), Panamanian ($45,593, a difference of 0.13%), Bermudan ($45,593, a difference of 0.13%), and Immigrants from Grenada ($45,596, a difference of 0.14%). Similarly, the demographic groups most similar to Immigrants from Nigeria are Native Hawaiian ($45,027, a difference of 0.010%), Immigrants from Iraq ($44,988, a difference of 0.090%), Immigrants from Cambodia ($45,090, a difference of 0.13%), West Indian ($45,132, a difference of 0.23%), and Scotch-Irish ($44,924, a difference of 0.24%).
| Demographics | Rating | Rank | Median Earnings |
| Immigrants | Grenada | 23.6 /100 | #210 | Fair $45,596 |
| Panamanians | 23.5 /100 | #211 | Fair $45,593 |
| Bermudans | 23.5 /100 | #212 | Fair $45,593 |
| Immigrants | Colombia | 22.4 /100 | #213 | Fair $45,550 |
| Nigerians | 22.0 /100 | #214 | Fair $45,532 |
| Immigrants | Bangladesh | 22.0 /100 | #215 | Fair $45,532 |
| Guyanese | 20.6 /100 | #216 | Fair $45,470 |
| Tlingit-Haida | 20.5 /100 | #217 | Fair $45,468 |
| Spanish | 19.7 /100 | #218 | Poor $45,432 |
| Dutch | 18.4 /100 | #219 | Poor $45,370 |
| Ecuadorians | 15.3 /100 | #220 | Poor $45,214 |
| Immigrants | Guyana | 15.1 /100 | #221 | Poor $45,204 |
| Immigrants | Panama | 15.0 /100 | #222 | Poor $45,198 |
| Whites/Caucasians | 15.0 /100 | #223 | Poor $45,197 |
| West Indians | 13.9 /100 | #224 | Poor $45,132 |
| Immigrants | Cambodia | 13.2 /100 | #225 | Poor $45,090 |
| Immigrants | Nigeria | 12.2 /100 | #226 | Poor $45,030 |
| Native Hawaiians | 12.2 /100 | #227 | Poor $45,027 |
| Immigrants | Iraq | 11.6 /100 | #228 | Poor $44,988 |
| Scotch-Irish | 10.7 /100 | #229 | Poor $44,924 |
| Immigrants | Western Africa | 10.3 /100 | #230 | Poor $44,893 |