Ukrainian vs Immigrants from Nigeria Median Earnings
COMPARE
Ukrainian
Immigrants from Nigeria
Median Earnings
Median Earnings Comparison
Ukrainians
Immigrants from Nigeria
$50,320
MEDIAN EARNINGS
99.6/ 100
METRIC RATING
80th/ 347
METRIC RANK
$45,030
MEDIAN EARNINGS
12.2/ 100
METRIC RATING
226th/ 347
METRIC RANK
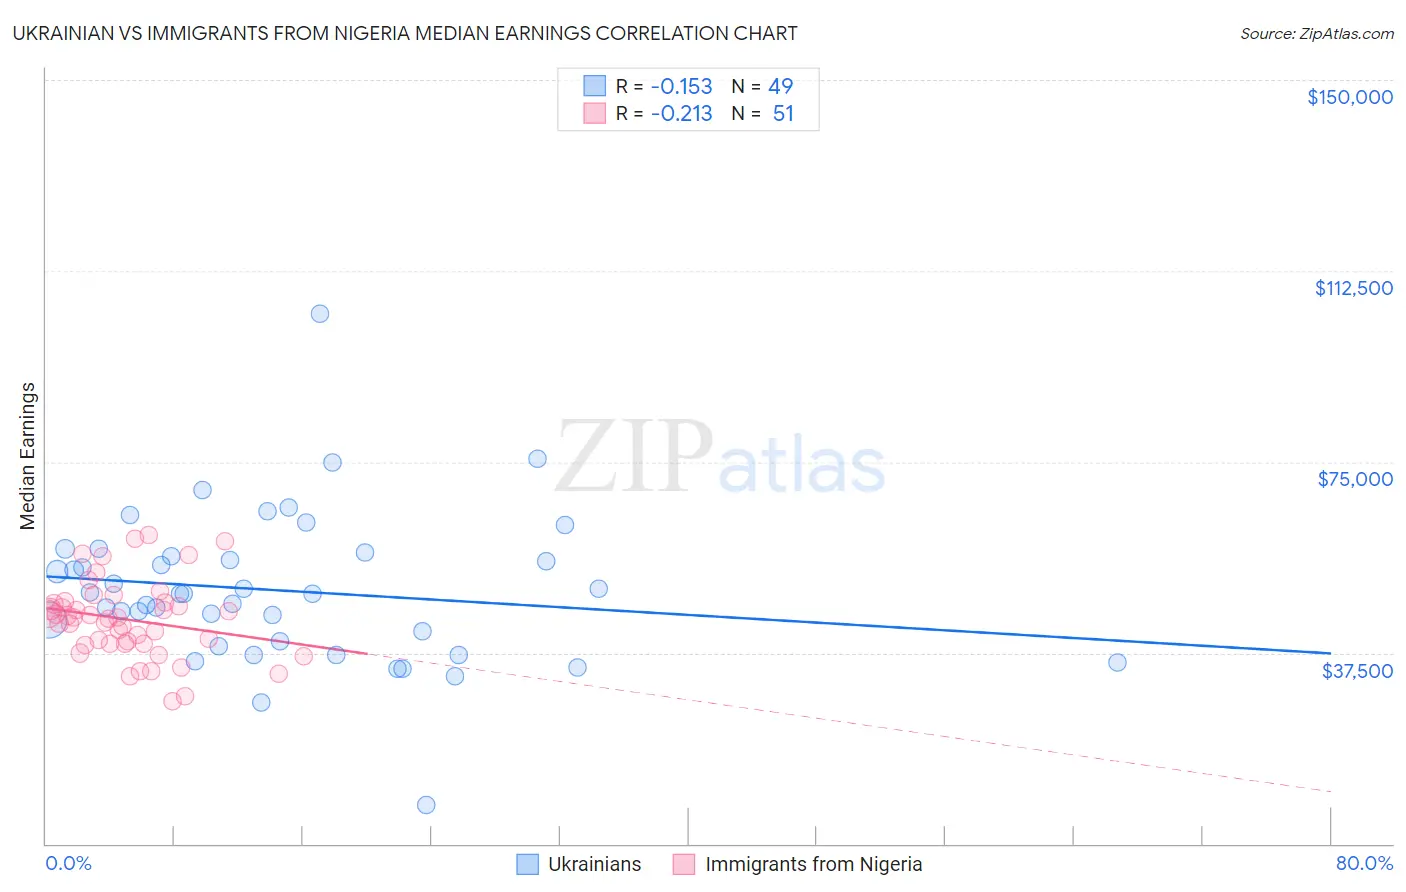
Ukrainian vs Immigrants from Nigeria Median Earnings Correlation Chart
The statistical analysis conducted on geographies consisting of 448,668,422 people shows a poor negative correlation between the proportion of Ukrainians and median earnings in the United States with a correlation coefficient (R) of -0.153 and weighted average of $50,320. Similarly, the statistical analysis conducted on geographies consisting of 283,479,904 people shows a weak negative correlation between the proportion of Immigrants from Nigeria and median earnings in the United States with a correlation coefficient (R) of -0.213 and weighted average of $45,030, a difference of 11.7%.
Median Earnings Correlation Summary
| Measurement | Ukrainian | Immigrants from Nigeria |
| Minimum | $7,500 | $28,094 |
| Maximum | $104,015 | $60,652 |
| Range | $96,515 | $32,558 |
| Mean | $49,735 | $44,023 |
| Median | $49,200 | $44,326 |
| Interquartile 25% (IQ1) | $39,295 | $39,209 |
| Interquartile 75% (IQ3) | $56,811 | $47,273 |
| Interquartile Range (IQR) | $17,516 | $8,064 |
| Standard Deviation (Sample) | $14,902 | $7,558 |
| Standard Deviation (Population) | $14,749 | $7,484 |
Similar Demographics by Median Earnings
Demographics Similar to Ukrainians by Median Earnings
In terms of median earnings, the demographic groups most similar to Ukrainians are Laotian ($50,343, a difference of 0.050%), Immigrants from Southern Europe ($50,280, a difference of 0.080%), Immigrants from Moldova ($50,274, a difference of 0.090%), Romanian ($50,244, a difference of 0.15%), and Argentinean ($50,399, a difference of 0.16%).
| Demographics | Rating | Rank | Median Earnings |
| Immigrants | Netherlands | 99.8 /100 | #73 | Exceptional $50,818 |
| South Africans | 99.8 /100 | #74 | Exceptional $50,752 |
| Immigrants | Scotland | 99.8 /100 | #75 | Exceptional $50,741 |
| Immigrants | Italy | 99.7 /100 | #76 | Exceptional $50,581 |
| Immigrants | Western Europe | 99.7 /100 | #77 | Exceptional $50,549 |
| Argentineans | 99.6 /100 | #78 | Exceptional $50,399 |
| Laotians | 99.6 /100 | #79 | Exceptional $50,343 |
| Ukrainians | 99.6 /100 | #80 | Exceptional $50,320 |
| Immigrants | Southern Europe | 99.6 /100 | #81 | Exceptional $50,280 |
| Immigrants | Moldova | 99.5 /100 | #82 | Exceptional $50,274 |
| Romanians | 99.5 /100 | #83 | Exceptional $50,244 |
| Immigrants | Hungary | 99.5 /100 | #84 | Exceptional $50,227 |
| Immigrants | Kazakhstan | 99.5 /100 | #85 | Exceptional $50,225 |
| Immigrants | Canada | 99.5 /100 | #86 | Exceptional $50,192 |
| Immigrants | Uzbekistan | 99.5 /100 | #87 | Exceptional $50,151 |
Demographics Similar to Immigrants from Nigeria by Median Earnings
In terms of median earnings, the demographic groups most similar to Immigrants from Nigeria are Native Hawaiian ($45,027, a difference of 0.010%), Immigrants from Iraq ($44,988, a difference of 0.090%), Immigrants from Cambodia ($45,090, a difference of 0.13%), West Indian ($45,132, a difference of 0.23%), and Scotch-Irish ($44,924, a difference of 0.24%).
| Demographics | Rating | Rank | Median Earnings |
| Dutch | 18.4 /100 | #219 | Poor $45,370 |
| Ecuadorians | 15.3 /100 | #220 | Poor $45,214 |
| Immigrants | Guyana | 15.1 /100 | #221 | Poor $45,204 |
| Immigrants | Panama | 15.0 /100 | #222 | Poor $45,198 |
| Whites/Caucasians | 15.0 /100 | #223 | Poor $45,197 |
| West Indians | 13.9 /100 | #224 | Poor $45,132 |
| Immigrants | Cambodia | 13.2 /100 | #225 | Poor $45,090 |
| Immigrants | Nigeria | 12.2 /100 | #226 | Poor $45,030 |
| Native Hawaiians | 12.2 /100 | #227 | Poor $45,027 |
| Immigrants | Iraq | 11.6 /100 | #228 | Poor $44,988 |
| Scotch-Irish | 10.7 /100 | #229 | Poor $44,924 |
| Immigrants | Western Africa | 10.3 /100 | #230 | Poor $44,893 |
| Japanese | 9.5 /100 | #231 | Tragic $44,825 |
| Delaware | 9.0 /100 | #232 | Tragic $44,783 |
| Immigrants | Sudan | 8.8 /100 | #233 | Tragic $44,767 |