Immigrants from Nepal vs Immigrants from Nigeria Median Earnings
COMPARE
Immigrants from Nepal
Immigrants from Nigeria
Median Earnings
Median Earnings Comparison
Immigrants from Nepal
Immigrants from Nigeria
$47,925
MEDIAN EARNINGS
89.0/ 100
METRIC RATING
137th/ 347
METRIC RANK
$45,030
MEDIAN EARNINGS
12.2/ 100
METRIC RATING
226th/ 347
METRIC RANK
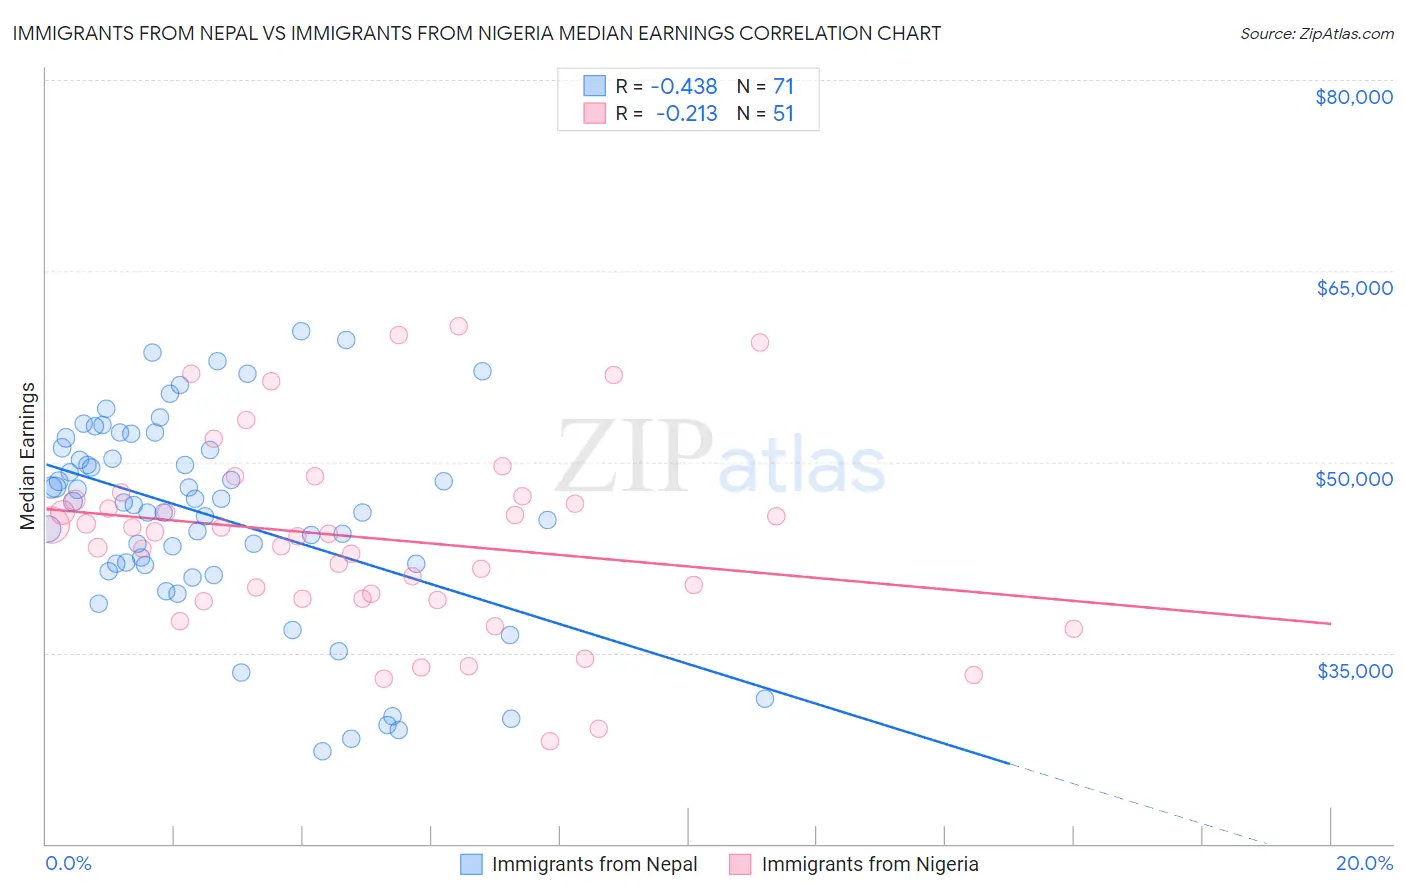
Immigrants from Nepal vs Immigrants from Nigeria Median Earnings Correlation Chart
The statistical analysis conducted on geographies consisting of 186,786,511 people shows a moderate negative correlation between the proportion of Immigrants from Nepal and median earnings in the United States with a correlation coefficient (R) of -0.438 and weighted average of $47,925. Similarly, the statistical analysis conducted on geographies consisting of 283,479,904 people shows a weak negative correlation between the proportion of Immigrants from Nigeria and median earnings in the United States with a correlation coefficient (R) of -0.213 and weighted average of $45,030, a difference of 6.4%.
Median Earnings Correlation Summary
| Measurement | Immigrants from Nepal | Immigrants from Nigeria |
| Minimum | $27,307 | $28,094 |
| Maximum | $60,227 | $60,652 |
| Range | $32,920 | $32,558 |
| Mean | $45,713 | $44,023 |
| Median | $46,771 | $44,326 |
| Interquartile 25% (IQ1) | $41,930 | $39,209 |
| Interquartile 75% (IQ3) | $51,099 | $47,273 |
| Interquartile Range (IQR) | $9,169 | $8,064 |
| Standard Deviation (Sample) | $7,950 | $7,558 |
| Standard Deviation (Population) | $7,894 | $7,484 |
Similar Demographics by Median Earnings
Demographics Similar to Immigrants from Nepal by Median Earnings
In terms of median earnings, the demographic groups most similar to Immigrants from Nepal are European ($47,915, a difference of 0.020%), Canadian ($47,911, a difference of 0.030%), Taiwanese ($47,902, a difference of 0.050%), Immigrants from Sierra Leone ($47,875, a difference of 0.11%), and Slovene ($47,995, a difference of 0.15%).
| Demographics | Rating | Rank | Median Earnings |
| Zimbabweans | 92.6 /100 | #130 | Exceptional $48,229 |
| Lebanese | 92.5 /100 | #131 | Exceptional $48,226 |
| British | 92.2 /100 | #132 | Exceptional $48,189 |
| Immigrants | Uganda | 90.5 /100 | #133 | Exceptional $48,041 |
| Sri Lankans | 90.5 /100 | #134 | Exceptional $48,040 |
| Portuguese | 90.4 /100 | #135 | Exceptional $48,032 |
| Slovenes | 90.0 /100 | #136 | Excellent $47,995 |
| Immigrants | Nepal | 89.0 /100 | #137 | Excellent $47,925 |
| Europeans | 88.9 /100 | #138 | Excellent $47,915 |
| Canadians | 88.8 /100 | #139 | Excellent $47,911 |
| Taiwanese | 88.7 /100 | #140 | Excellent $47,902 |
| Immigrants | Sierra Leone | 88.3 /100 | #141 | Excellent $47,875 |
| Ugandans | 88.0 /100 | #142 | Excellent $47,854 |
| Swedes | 88.0 /100 | #143 | Excellent $47,851 |
| Hungarians | 87.1 /100 | #144 | Excellent $47,795 |
Demographics Similar to Immigrants from Nigeria by Median Earnings
In terms of median earnings, the demographic groups most similar to Immigrants from Nigeria are Native Hawaiian ($45,027, a difference of 0.010%), Immigrants from Iraq ($44,988, a difference of 0.090%), Immigrants from Cambodia ($45,090, a difference of 0.13%), West Indian ($45,132, a difference of 0.23%), and Scotch-Irish ($44,924, a difference of 0.24%).
| Demographics | Rating | Rank | Median Earnings |
| Dutch | 18.4 /100 | #219 | Poor $45,370 |
| Ecuadorians | 15.3 /100 | #220 | Poor $45,214 |
| Immigrants | Guyana | 15.1 /100 | #221 | Poor $45,204 |
| Immigrants | Panama | 15.0 /100 | #222 | Poor $45,198 |
| Whites/Caucasians | 15.0 /100 | #223 | Poor $45,197 |
| West Indians | 13.9 /100 | #224 | Poor $45,132 |
| Immigrants | Cambodia | 13.2 /100 | #225 | Poor $45,090 |
| Immigrants | Nigeria | 12.2 /100 | #226 | Poor $45,030 |
| Native Hawaiians | 12.2 /100 | #227 | Poor $45,027 |
| Immigrants | Iraq | 11.6 /100 | #228 | Poor $44,988 |
| Scotch-Irish | 10.7 /100 | #229 | Poor $44,924 |
| Immigrants | Western Africa | 10.3 /100 | #230 | Poor $44,893 |
| Japanese | 9.5 /100 | #231 | Tragic $44,825 |
| Delaware | 9.0 /100 | #232 | Tragic $44,783 |
| Immigrants | Sudan | 8.8 /100 | #233 | Tragic $44,767 |