Immigrants from Lithuania vs Immigrants from Bolivia Median Earnings
COMPARE
Immigrants from Lithuania
Immigrants from Bolivia
Median Earnings
Median Earnings Comparison
Immigrants from Lithuania
Immigrants from Bolivia
$52,769
MEDIAN EARNINGS
100.0/ 100
METRIC RATING
41st/ 347
METRIC RANK
$51,605
MEDIAN EARNINGS
99.9/ 100
METRIC RATING
58th/ 347
METRIC RANK
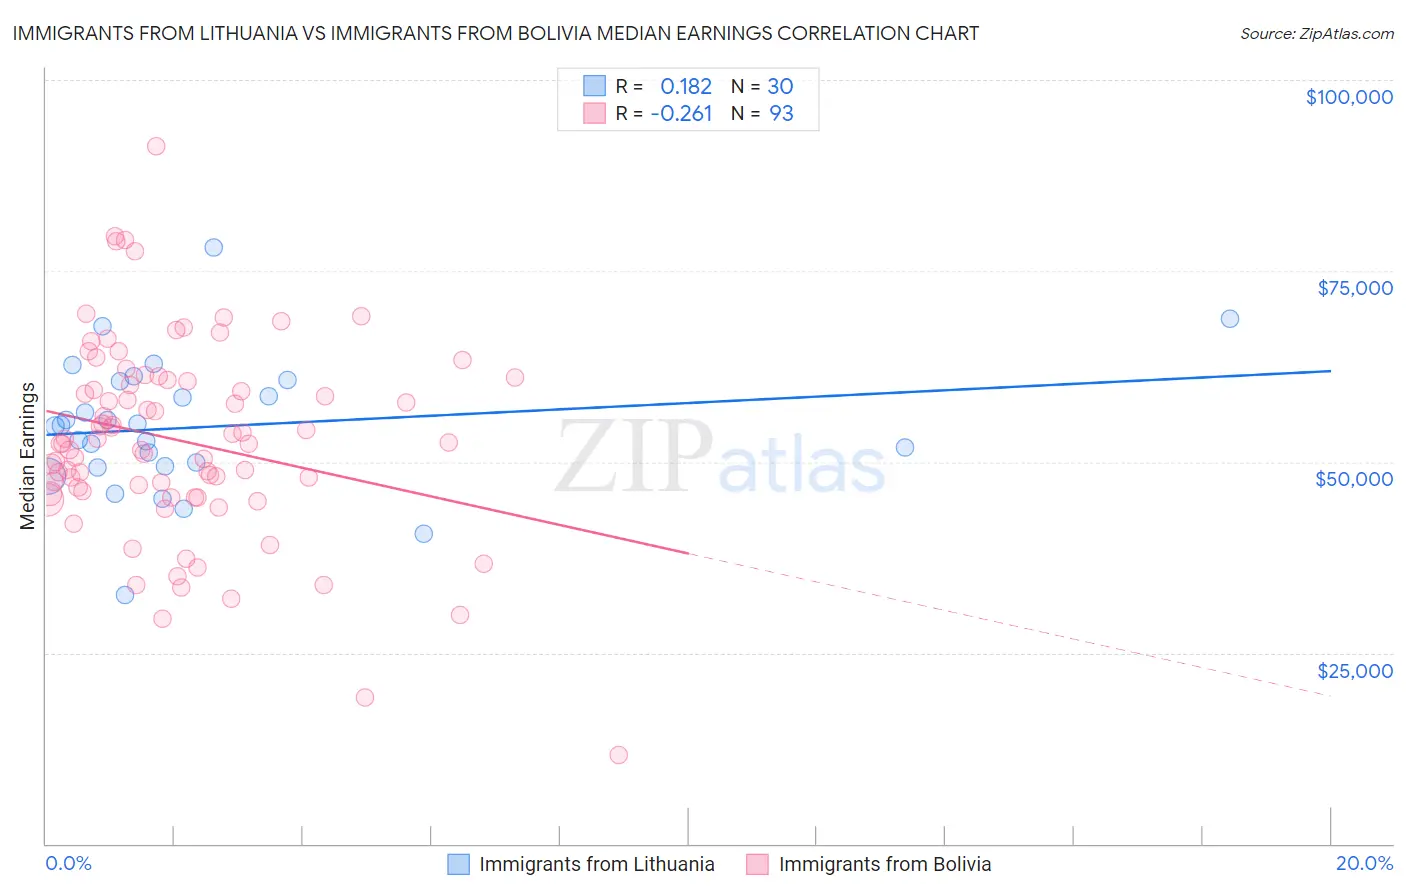
Immigrants from Lithuania vs Immigrants from Bolivia Median Earnings Correlation Chart
The statistical analysis conducted on geographies consisting of 117,724,669 people shows a poor positive correlation between the proportion of Immigrants from Lithuania and median earnings in the United States with a correlation coefficient (R) of 0.182 and weighted average of $52,769. Similarly, the statistical analysis conducted on geographies consisting of 158,712,094 people shows a weak negative correlation between the proportion of Immigrants from Bolivia and median earnings in the United States with a correlation coefficient (R) of -0.261 and weighted average of $51,605, a difference of 2.3%.
Median Earnings Correlation Summary
| Measurement | Immigrants from Lithuania | Immigrants from Bolivia |
| Minimum | $32,646 | $11,650 |
| Maximum | $78,046 | $91,262 |
| Range | $45,400 | $79,612 |
| Mean | $54,582 | $52,755 |
| Median | $54,749 | $52,407 |
| Interquartile 25% (IQ1) | $49,388 | $46,026 |
| Interquartile 75% (IQ3) | $60,605 | $60,689 |
| Interquartile Range (IQR) | $11,217 | $14,663 |
| Standard Deviation (Sample) | $8,932 | $12,931 |
| Standard Deviation (Population) | $8,782 | $12,861 |
Demographics Similar to Immigrants from Lithuania and Immigrants from Bolivia by Median Earnings
In terms of median earnings, the demographic groups most similar to Immigrants from Lithuania are Israeli ($52,937, a difference of 0.32%), Immigrants from Turkey ($52,960, a difference of 0.36%), Maltese ($52,526, a difference of 0.46%), Immigrants from Malaysia ($52,514, a difference of 0.49%), and Bulgarian ($52,512, a difference of 0.49%). Similarly, the demographic groups most similar to Immigrants from Bolivia are Immigrants from Eastern Europe ($51,624, a difference of 0.040%), Immigrants from Croatia ($51,581, a difference of 0.050%), Immigrants from Pakistan ($51,693, a difference of 0.17%), Egyptian ($51,701, a difference of 0.18%), and Immigrants from Indonesia ($51,715, a difference of 0.21%).
| Demographics | Rating | Rank | Median Earnings |
| Immigrants | Turkey | 100.0 /100 | #39 | Exceptional $52,960 |
| Israelis | 100.0 /100 | #40 | Exceptional $52,937 |
| Immigrants | Lithuania | 100.0 /100 | #41 | Exceptional $52,769 |
| Maltese | 100.0 /100 | #42 | Exceptional $52,526 |
| Immigrants | Malaysia | 100.0 /100 | #43 | Exceptional $52,514 |
| Bulgarians | 100.0 /100 | #44 | Exceptional $52,512 |
| Immigrants | Czechoslovakia | 100.0 /100 | #45 | Exceptional $52,361 |
| Bhutanese | 100.0 /100 | #46 | Exceptional $52,297 |
| Australians | 100.0 /100 | #47 | Exceptional $52,294 |
| Immigrants | Europe | 100.0 /100 | #48 | Exceptional $52,195 |
| Bolivians | 100.0 /100 | #49 | Exceptional $52,005 |
| Immigrants | South Africa | 100.0 /100 | #50 | Exceptional $51,850 |
| Immigrants | Austria | 99.9 /100 | #51 | Exceptional $51,826 |
| Estonians | 99.9 /100 | #52 | Exceptional $51,772 |
| Immigrants | Norway | 99.9 /100 | #53 | Exceptional $51,758 |
| Immigrants | Indonesia | 99.9 /100 | #54 | Exceptional $51,715 |
| Egyptians | 99.9 /100 | #55 | Exceptional $51,701 |
| Immigrants | Pakistan | 99.9 /100 | #56 | Exceptional $51,693 |
| Immigrants | Eastern Europe | 99.9 /100 | #57 | Exceptional $51,624 |
| Immigrants | Bolivia | 99.9 /100 | #58 | Exceptional $51,605 |
| Immigrants | Croatia | 99.9 /100 | #59 | Exceptional $51,581 |