Osage vs Immigrants from Bolivia Median Earnings
COMPARE
Osage
Immigrants from Bolivia
Median Earnings
Median Earnings Comparison
Osage
Immigrants from Bolivia
$42,651
MEDIAN EARNINGS
0.5/ 100
METRIC RATING
270th/ 347
METRIC RANK
$51,605
MEDIAN EARNINGS
99.9/ 100
METRIC RATING
58th/ 347
METRIC RANK
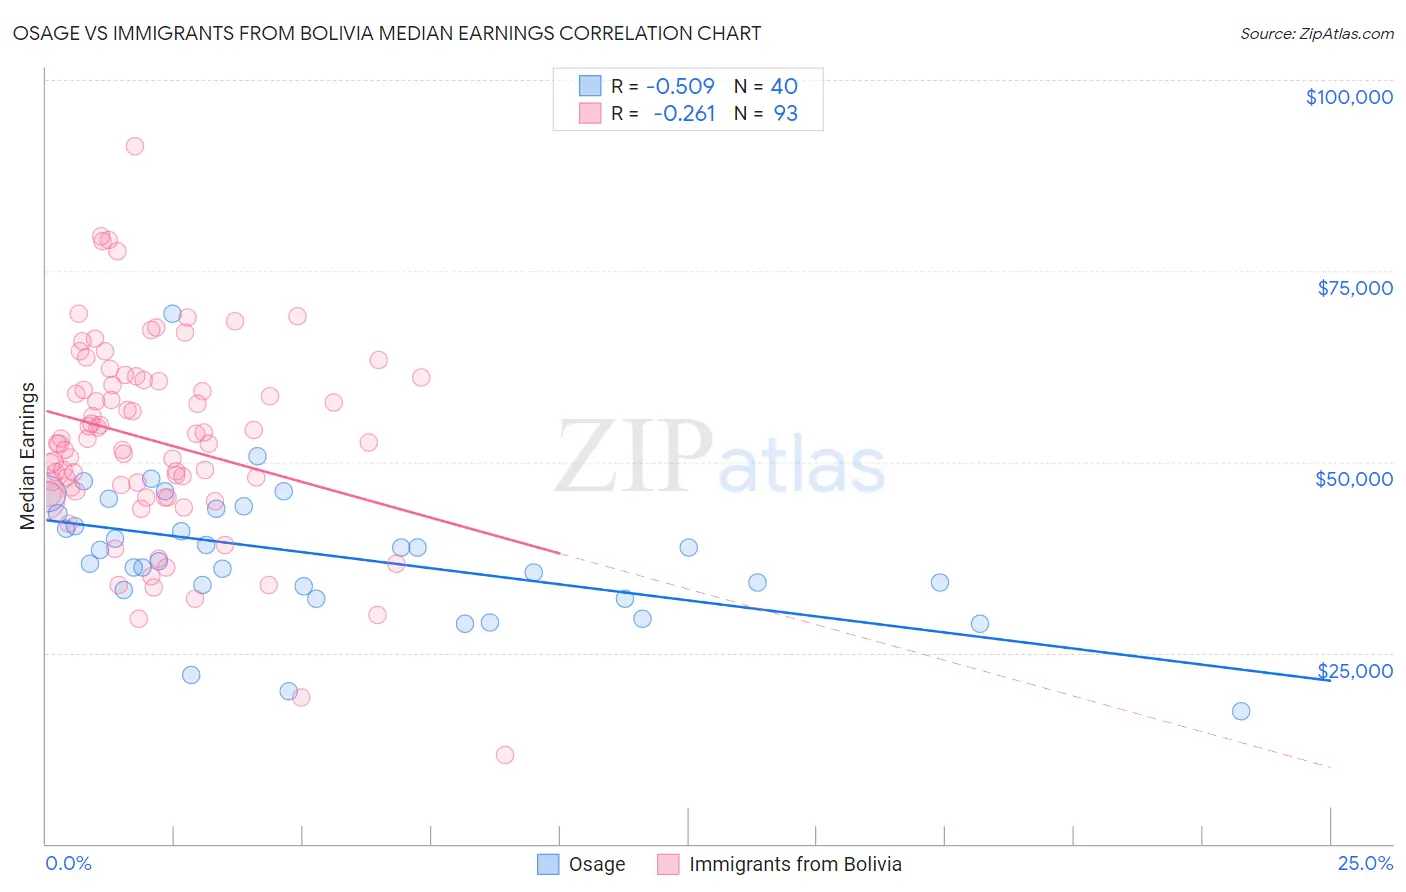
Osage vs Immigrants from Bolivia Median Earnings Correlation Chart
The statistical analysis conducted on geographies consisting of 91,804,179 people shows a substantial negative correlation between the proportion of Osage and median earnings in the United States with a correlation coefficient (R) of -0.509 and weighted average of $42,651. Similarly, the statistical analysis conducted on geographies consisting of 158,712,094 people shows a weak negative correlation between the proportion of Immigrants from Bolivia and median earnings in the United States with a correlation coefficient (R) of -0.261 and weighted average of $51,605, a difference of 21.0%.
Median Earnings Correlation Summary
| Measurement | Osage | Immigrants from Bolivia |
| Minimum | $17,308 | $11,650 |
| Maximum | $69,422 | $91,262 |
| Range | $52,114 | $79,612 |
| Mean | $37,848 | $52,755 |
| Median | $37,712 | $52,407 |
| Interquartile 25% (IQ1) | $33,454 | $46,026 |
| Interquartile 75% (IQ3) | $43,538 | $60,689 |
| Interquartile Range (IQR) | $10,084 | $14,663 |
| Standard Deviation (Sample) | $9,089 | $12,931 |
| Standard Deviation (Population) | $8,975 | $12,861 |
Similar Demographics by Median Earnings
Demographics Similar to Osage by Median Earnings
In terms of median earnings, the demographic groups most similar to Osage are Pennsylvania German ($42,615, a difference of 0.090%), Belizean ($42,702, a difference of 0.12%), American ($42,742, a difference of 0.21%), Cree ($42,777, a difference of 0.29%), and Iroquois ($42,430, a difference of 0.52%).
| Demographics | Rating | Rank | Median Earnings |
| Inupiat | 0.8 /100 | #263 | Tragic $43,000 |
| Immigrants | Liberia | 0.7 /100 | #264 | Tragic $42,923 |
| Salvadorans | 0.7 /100 | #265 | Tragic $42,912 |
| Immigrants | Laos | 0.7 /100 | #266 | Tragic $42,884 |
| Cree | 0.6 /100 | #267 | Tragic $42,777 |
| Americans | 0.6 /100 | #268 | Tragic $42,742 |
| Belizeans | 0.5 /100 | #269 | Tragic $42,702 |
| Osage | 0.5 /100 | #270 | Tragic $42,651 |
| Pennsylvania Germans | 0.5 /100 | #271 | Tragic $42,615 |
| Iroquois | 0.4 /100 | #272 | Tragic $42,430 |
| Immigrants | Dominica | 0.4 /100 | #273 | Tragic $42,420 |
| Immigrants | El Salvador | 0.4 /100 | #274 | Tragic $42,413 |
| Immigrants | Belize | 0.3 /100 | #275 | Tragic $42,339 |
| Spanish Americans | 0.3 /100 | #276 | Tragic $42,316 |
| Central Americans | 0.3 /100 | #277 | Tragic $42,280 |
Demographics Similar to Immigrants from Bolivia by Median Earnings
In terms of median earnings, the demographic groups most similar to Immigrants from Bolivia are Immigrants from Eastern Europe ($51,624, a difference of 0.040%), Immigrants from Croatia ($51,581, a difference of 0.050%), Immigrants from Serbia ($51,557, a difference of 0.090%), Immigrants from Latvia ($51,555, a difference of 0.10%), and Immigrants from Pakistan ($51,693, a difference of 0.17%).
| Demographics | Rating | Rank | Median Earnings |
| Immigrants | Austria | 99.9 /100 | #51 | Exceptional $51,826 |
| Estonians | 99.9 /100 | #52 | Exceptional $51,772 |
| Immigrants | Norway | 99.9 /100 | #53 | Exceptional $51,758 |
| Immigrants | Indonesia | 99.9 /100 | #54 | Exceptional $51,715 |
| Egyptians | 99.9 /100 | #55 | Exceptional $51,701 |
| Immigrants | Pakistan | 99.9 /100 | #56 | Exceptional $51,693 |
| Immigrants | Eastern Europe | 99.9 /100 | #57 | Exceptional $51,624 |
| Immigrants | Bolivia | 99.9 /100 | #58 | Exceptional $51,605 |
| Immigrants | Croatia | 99.9 /100 | #59 | Exceptional $51,581 |
| Immigrants | Serbia | 99.9 /100 | #60 | Exceptional $51,557 |
| Immigrants | Latvia | 99.9 /100 | #61 | Exceptional $51,555 |
| Immigrants | Romania | 99.9 /100 | #62 | Exceptional $51,337 |
| Immigrants | Bulgaria | 99.9 /100 | #63 | Exceptional $51,318 |
| New Zealanders | 99.9 /100 | #64 | Exceptional $51,246 |
| Greeks | 99.9 /100 | #65 | Exceptional $51,164 |