Comanche vs Immigrants from Bolivia No Schooling Completed
COMPARE
Comanche
Immigrants from Bolivia
No Schooling Completed
No Schooling Completed Comparison
Comanche
Immigrants from Bolivia
2.1%
NO SCHOOLING COMPLETED
60.7/ 100
METRIC RATING
164th/ 347
METRIC RANK
2.5%
NO SCHOOLING COMPLETED
0.2/ 100
METRIC RATING
272nd/ 347
METRIC RANK
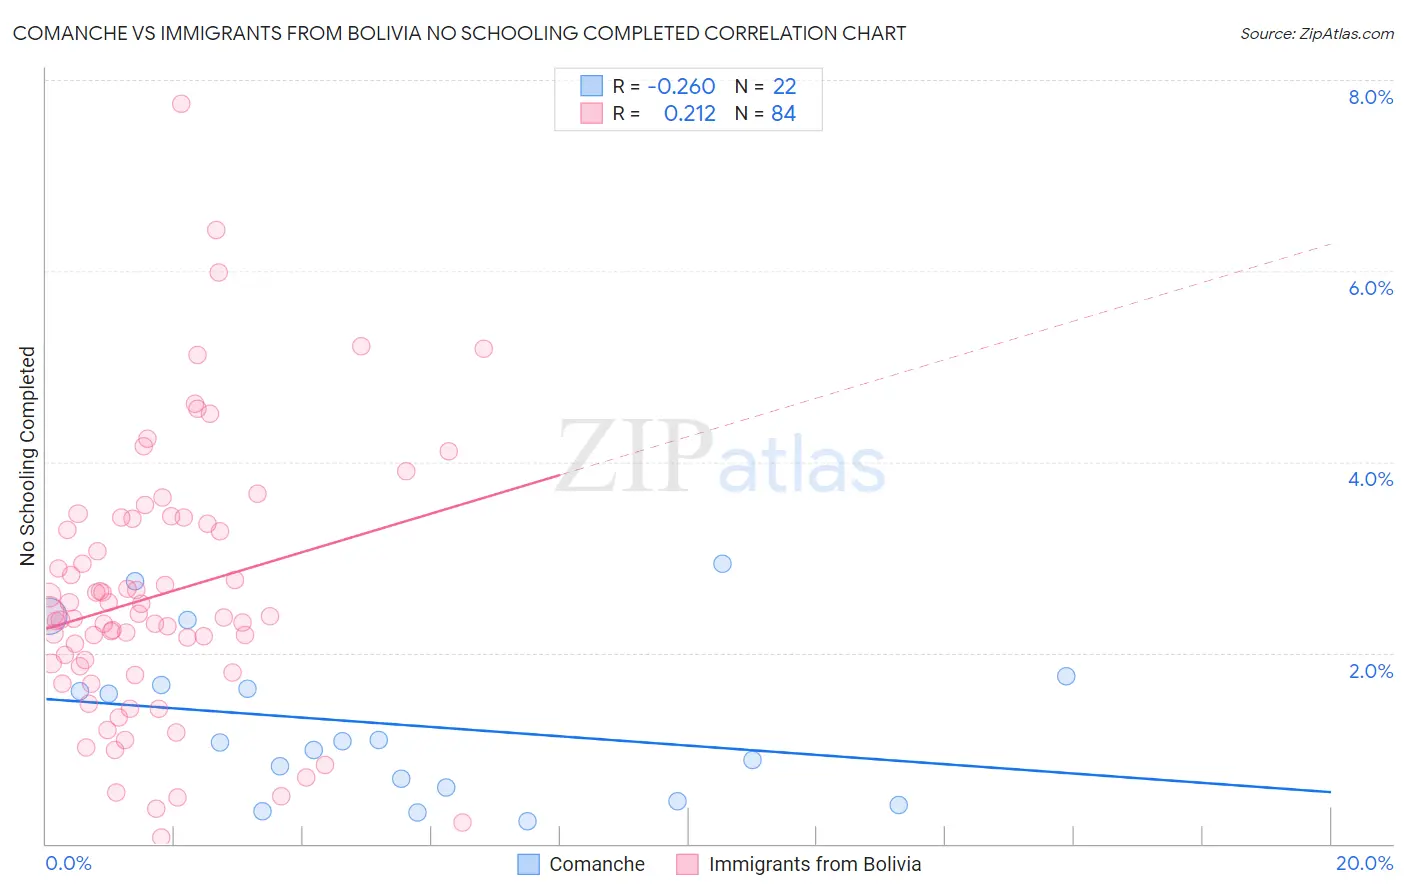
Comanche vs Immigrants from Bolivia No Schooling Completed Correlation Chart
The statistical analysis conducted on geographies consisting of 109,390,428 people shows a weak negative correlation between the proportion of Comanche and percentage of population with no schooling in the United States with a correlation coefficient (R) of -0.260 and weighted average of 2.1%. Similarly, the statistical analysis conducted on geographies consisting of 158,366,441 people shows a weak positive correlation between the proportion of Immigrants from Bolivia and percentage of population with no schooling in the United States with a correlation coefficient (R) of 0.212 and weighted average of 2.5%, a difference of 22.7%.
No Schooling Completed Correlation Summary
| Measurement | Comanche | Immigrants from Bolivia |
| Minimum | 0.23% | 0.063% |
| Maximum | 2.9% | 7.8% |
| Range | 2.7% | 7.7% |
| Mean | 1.3% | 2.6% |
| Median | 1.1% | 2.4% |
| Interquartile 25% (IQ1) | 0.59% | 1.8% |
| Interquartile 75% (IQ3) | 1.7% | 3.4% |
| Interquartile Range (IQR) | 1.1% | 1.5% |
| Standard Deviation (Sample) | 0.81% | 1.4% |
| Standard Deviation (Population) | 0.79% | 1.4% |
Similar Demographics by No Schooling Completed
Demographics Similar to Comanche by No Schooling Completed
In terms of no schooling completed, the demographic groups most similar to Comanche are Brazilian (2.1%, a difference of 0.060%), Dutch West Indian (2.1%, a difference of 0.11%), Egyptian (2.1%, a difference of 0.21%), Albanian (2.1%, a difference of 0.22%), and Cheyenne (2.1%, a difference of 0.29%).
| Demographics | Rating | Rank | No Schooling Completed |
| Immigrants | Sri Lanka | 67.0 /100 | #157 | Good 2.0% |
| Immigrants | Korea | 66.7 /100 | #158 | Good 2.0% |
| Immigrants | Spain | 66.4 /100 | #159 | Good 2.0% |
| Kenyans | 65.7 /100 | #160 | Good 2.0% |
| Ugandans | 64.6 /100 | #161 | Good 2.0% |
| Immigrants | Brazil | 63.8 /100 | #162 | Good 2.1% |
| Albanians | 62.2 /100 | #163 | Good 2.1% |
| Comanche | 60.7 /100 | #164 | Good 2.1% |
| Brazilians | 60.2 /100 | #165 | Good 2.1% |
| Dutch West Indians | 59.9 /100 | #166 | Average 2.1% |
| Egyptians | 59.2 /100 | #167 | Average 2.1% |
| Cheyenne | 58.6 /100 | #168 | Average 2.1% |
| Apache | 56.7 /100 | #169 | Average 2.1% |
| Argentineans | 56.0 /100 | #170 | Average 2.1% |
| Immigrants | Poland | 55.2 /100 | #171 | Average 2.1% |
Demographics Similar to Immigrants from Bolivia by No Schooling Completed
In terms of no schooling completed, the demographic groups most similar to Immigrants from Bolivia are Cuban (2.5%, a difference of 0.53%), Immigrants from Peru (2.5%, a difference of 0.54%), Immigrants from Nigeria (2.5%, a difference of 0.62%), Immigrants from Cameroon (2.5%, a difference of 0.79%), and Ghanaian (2.6%, a difference of 1.2%).
| Demographics | Rating | Rank | No Schooling Completed |
| West Indians | 0.4 /100 | #265 | Tragic 2.5% |
| Fijians | 0.4 /100 | #266 | Tragic 2.5% |
| Yuman | 0.4 /100 | #267 | Tragic 2.5% |
| Taiwanese | 0.3 /100 | #268 | Tragic 2.5% |
| Immigrants | Nigeria | 0.2 /100 | #269 | Tragic 2.5% |
| Immigrants | Peru | 0.2 /100 | #270 | Tragic 2.5% |
| Cubans | 0.2 /100 | #271 | Tragic 2.5% |
| Immigrants | Bolivia | 0.2 /100 | #272 | Tragic 2.5% |
| Immigrants | Cameroon | 0.1 /100 | #273 | Tragic 2.5% |
| Ghanaians | 0.1 /100 | #274 | Tragic 2.6% |
| Immigrants | China | 0.1 /100 | #275 | Tragic 2.6% |
| Immigrants | Western Africa | 0.1 /100 | #276 | Tragic 2.6% |
| Immigrants | Philippines | 0.1 /100 | #277 | Tragic 2.6% |
| Immigrants | Uzbekistan | 0.1 /100 | #278 | Tragic 2.6% |
| Barbadians | 0.1 /100 | #279 | Tragic 2.6% |