Immigrants from Fiji vs Chickasaw Median Earnings
COMPARE
Immigrants from Fiji
Chickasaw
Median Earnings
Median Earnings Comparison
Immigrants from Fiji
Chickasaw
$48,305
MEDIAN EARNINGS
93.3/ 100
METRIC RATING
125th/ 347
METRIC RANK
$40,672
MEDIAN EARNINGS
0.0/ 100
METRIC RATING
305th/ 347
METRIC RANK
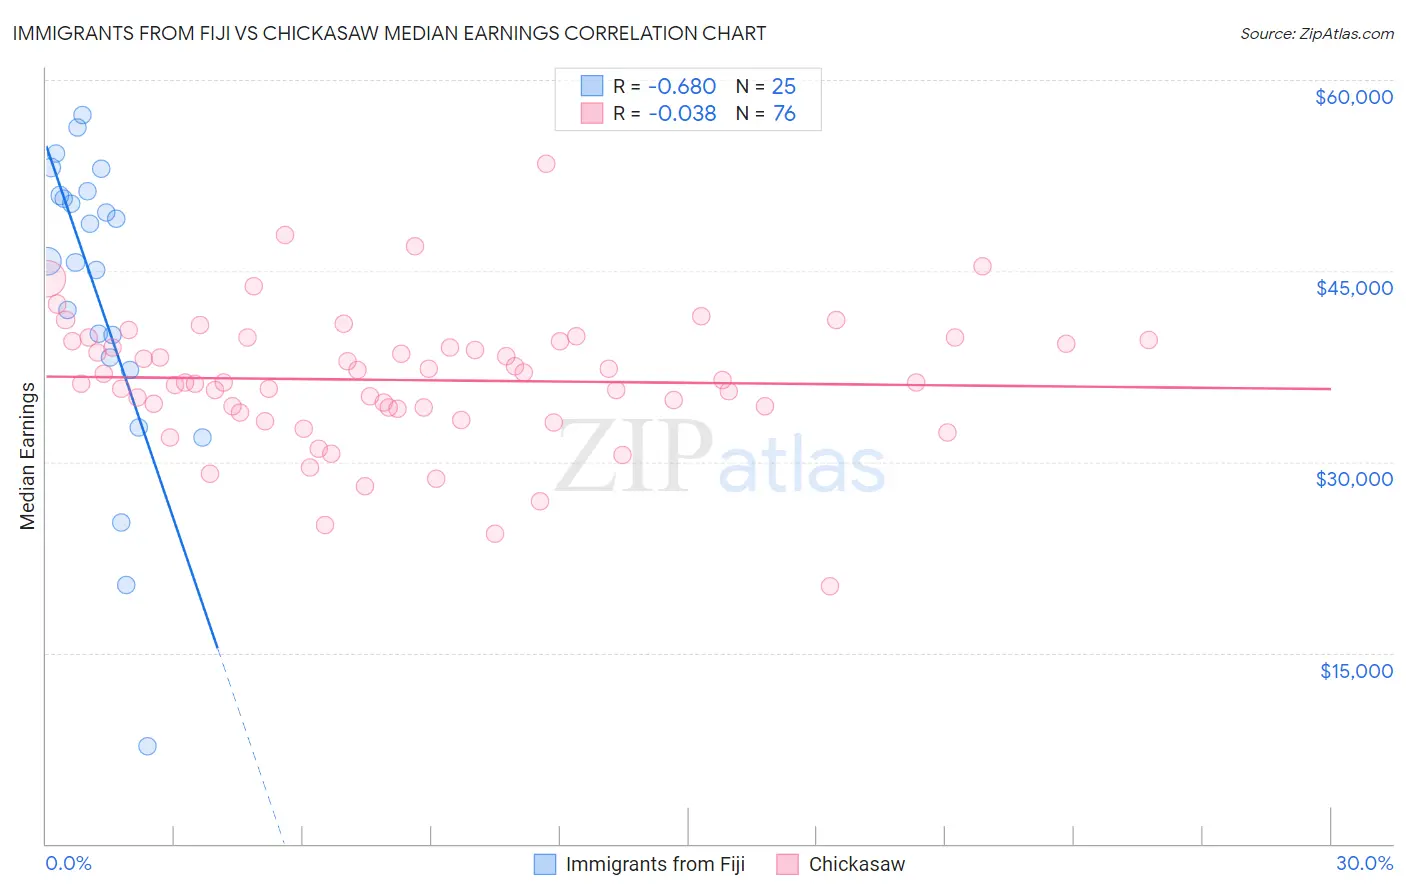
Immigrants from Fiji vs Chickasaw Median Earnings Correlation Chart
The statistical analysis conducted on geographies consisting of 93,756,016 people shows a significant negative correlation between the proportion of Immigrants from Fiji and median earnings in the United States with a correlation coefficient (R) of -0.680 and weighted average of $48,305. Similarly, the statistical analysis conducted on geographies consisting of 147,718,191 people shows no correlation between the proportion of Chickasaw and median earnings in the United States with a correlation coefficient (R) of -0.038 and weighted average of $40,672, a difference of 18.8%.
Median Earnings Correlation Summary
| Measurement | Immigrants from Fiji | Chickasaw |
| Minimum | $7,703 | $20,250 |
| Maximum | $57,229 | $53,432 |
| Range | $49,526 | $33,182 |
| Mean | $43,044 | $36,428 |
| Median | $45,776 | $36,238 |
| Interquartile 25% (IQ1) | $37,711 | $34,220 |
| Interquartile 75% (IQ3) | $51,118 | $39,491 |
| Interquartile Range (IQR) | $13,407 | $5,270 |
| Standard Deviation (Sample) | $12,014 | $5,289 |
| Standard Deviation (Population) | $11,772 | $5,254 |
Similar Demographics by Median Earnings
Demographics Similar to Immigrants from Fiji by Median Earnings
In terms of median earnings, the demographic groups most similar to Immigrants from Fiji are Assyrian/Chaldean/Syriac ($48,304, a difference of 0.0%), Sierra Leonean ($48,286, a difference of 0.040%), Immigrants from Philippines ($48,266, a difference of 0.080%), Brazilian ($48,356, a difference of 0.11%), and Pakistani ($48,254, a difference of 0.11%).
| Demographics | Rating | Rank | Median Earnings |
| Immigrants | Jordan | 95.9 /100 | #118 | Exceptional $48,673 |
| Poles | 95.8 /100 | #119 | Exceptional $48,659 |
| Carpatho Rusyns | 95.5 /100 | #120 | Exceptional $48,617 |
| Arabs | 95.4 /100 | #121 | Exceptional $48,599 |
| Chileans | 94.8 /100 | #122 | Exceptional $48,504 |
| Immigrants | Syria | 93.9 /100 | #123 | Exceptional $48,375 |
| Brazilians | 93.7 /100 | #124 | Exceptional $48,356 |
| Immigrants | Fiji | 93.3 /100 | #125 | Exceptional $48,305 |
| Assyrians/Chaldeans/Syriacs | 93.3 /100 | #126 | Exceptional $48,304 |
| Sierra Leoneans | 93.1 /100 | #127 | Exceptional $48,286 |
| Immigrants | Philippines | 92.9 /100 | #128 | Exceptional $48,266 |
| Pakistanis | 92.8 /100 | #129 | Exceptional $48,254 |
| Zimbabweans | 92.6 /100 | #130 | Exceptional $48,229 |
| Lebanese | 92.5 /100 | #131 | Exceptional $48,226 |
| British | 92.2 /100 | #132 | Exceptional $48,189 |
Demographics Similar to Chickasaw by Median Earnings
In terms of median earnings, the demographic groups most similar to Chickasaw are Yaqui ($40,647, a difference of 0.060%), Honduran ($40,638, a difference of 0.080%), Cuban ($40,619, a difference of 0.13%), Immigrants from Haiti ($40,550, a difference of 0.30%), and Immigrants from Guatemala ($40,851, a difference of 0.44%).
| Demographics | Rating | Rank | Median Earnings |
| Immigrants | Micronesia | 0.1 /100 | #298 | Tragic $41,133 |
| Immigrants | Caribbean | 0.1 /100 | #299 | Tragic $41,119 |
| Ute | 0.1 /100 | #300 | Tragic $41,051 |
| Immigrants | Latin America | 0.1 /100 | #301 | Tragic $41,049 |
| Shoshone | 0.0 /100 | #302 | Tragic $40,932 |
| Haitians | 0.0 /100 | #303 | Tragic $40,918 |
| Immigrants | Guatemala | 0.0 /100 | #304 | Tragic $40,851 |
| Chickasaw | 0.0 /100 | #305 | Tragic $40,672 |
| Yaqui | 0.0 /100 | #306 | Tragic $40,647 |
| Hondurans | 0.0 /100 | #307 | Tragic $40,638 |
| Cubans | 0.0 /100 | #308 | Tragic $40,619 |
| Immigrants | Haiti | 0.0 /100 | #309 | Tragic $40,550 |
| Apache | 0.0 /100 | #310 | Tragic $40,388 |
| Hispanics or Latinos | 0.0 /100 | #311 | Tragic $40,288 |
| Chippewa | 0.0 /100 | #312 | Tragic $40,287 |