Colville vs Immigrants from Nigeria Per Capita Income
COMPARE
Colville
Immigrants from Nigeria
Per Capita Income
Per Capita Income Comparison
Colville
Immigrants from Nigeria
$38,047
PER CAPITA INCOME
0.2/ 100
METRIC RATING
279th/ 347
METRIC RANK
$40,339
PER CAPITA INCOME
2.3/ 100
METRIC RATING
240th/ 347
METRIC RANK
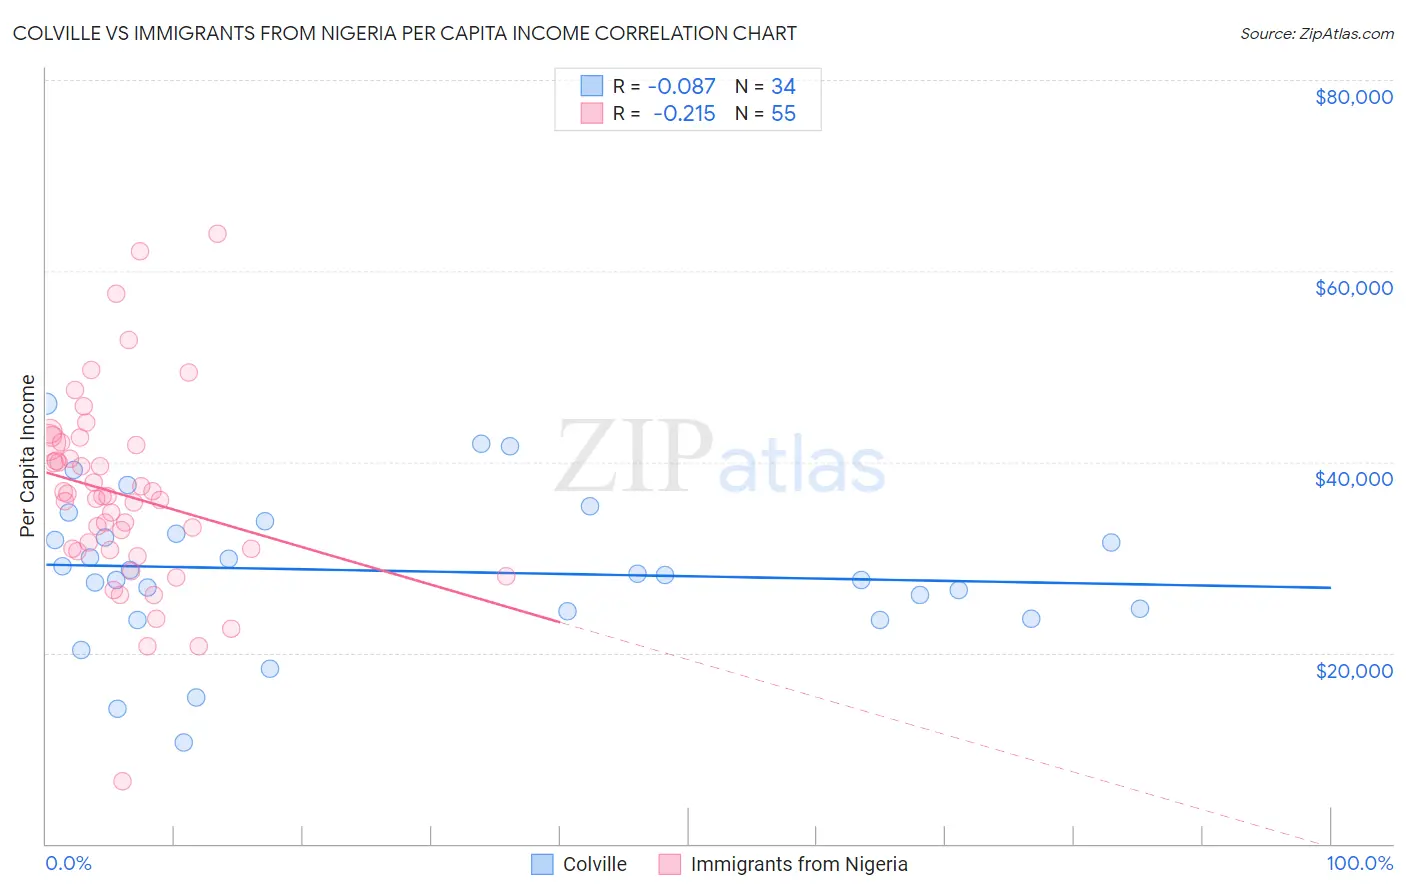
Colville vs Immigrants from Nigeria Per Capita Income Correlation Chart
The statistical analysis conducted on geographies consisting of 34,687,707 people shows a slight negative correlation between the proportion of Colville and per capita income in the United States with a correlation coefficient (R) of -0.087 and weighted average of $38,047. Similarly, the statistical analysis conducted on geographies consisting of 283,501,932 people shows a weak negative correlation between the proportion of Immigrants from Nigeria and per capita income in the United States with a correlation coefficient (R) of -0.215 and weighted average of $40,339, a difference of 6.0%.
Per Capita Income Correlation Summary
| Measurement | Colville | Immigrants from Nigeria |
| Minimum | $10,541 | $6,524 |
| Maximum | $46,065 | $63,917 |
| Range | $35,524 | $57,393 |
| Mean | $28,594 | $36,581 |
| Median | $28,215 | $36,394 |
| Interquartile 25% (IQ1) | $24,418 | $30,744 |
| Interquartile 75% (IQ3) | $32,462 | $42,001 |
| Interquartile Range (IQR) | $8,044 | $11,256 |
| Standard Deviation (Sample) | $7,817 | $10,124 |
| Standard Deviation (Population) | $7,701 | $10,032 |
Similar Demographics by Per Capita Income
Demographics Similar to Colville by Per Capita Income
In terms of per capita income, the demographic groups most similar to Colville are Potawatomi ($38,046, a difference of 0.0%), Immigrants from Nicaragua ($38,065, a difference of 0.050%), Comanche ($38,088, a difference of 0.11%), Hmong ($38,120, a difference of 0.19%), and Immigrants from Dominica ($37,952, a difference of 0.25%).
| Demographics | Rating | Rank | Per Capita Income |
| Immigrants | Cabo Verde | 0.3 /100 | #272 | Tragic $38,540 |
| Nepalese | 0.3 /100 | #273 | Tragic $38,442 |
| Immigrants | El Salvador | 0.3 /100 | #274 | Tragic $38,394 |
| Immigrants | Liberia | 0.2 /100 | #275 | Tragic $38,165 |
| Hmong | 0.2 /100 | #276 | Tragic $38,120 |
| Comanche | 0.2 /100 | #277 | Tragic $38,088 |
| Immigrants | Nicaragua | 0.2 /100 | #278 | Tragic $38,065 |
| Colville | 0.2 /100 | #279 | Tragic $38,047 |
| Potawatomi | 0.2 /100 | #280 | Tragic $38,046 |
| Immigrants | Dominica | 0.2 /100 | #281 | Tragic $37,952 |
| Immigrants | Laos | 0.1 /100 | #282 | Tragic $37,857 |
| Pennsylvania Germans | 0.1 /100 | #283 | Tragic $37,842 |
| Africans | 0.1 /100 | #284 | Tragic $37,785 |
| Guatemalans | 0.1 /100 | #285 | Tragic $37,766 |
| Central American Indians | 0.1 /100 | #286 | Tragic $37,699 |
Demographics Similar to Immigrants from Nigeria by Per Capita Income
In terms of per capita income, the demographic groups most similar to Immigrants from Nigeria are Tsimshian ($40,344, a difference of 0.010%), British West Indian ($40,330, a difference of 0.020%), Somali ($40,367, a difference of 0.070%), Immigrants from Western Africa ($40,294, a difference of 0.11%), and German Russian ($40,266, a difference of 0.18%).
| Demographics | Rating | Rank | Per Capita Income |
| Delaware | 3.8 /100 | #233 | Tragic $40,778 |
| Immigrants | West Indies | 3.7 /100 | #234 | Tragic $40,763 |
| Immigrants | Guyana | 3.6 /100 | #235 | Tragic $40,742 |
| Immigrants | Nonimmigrants | 3.4 /100 | #236 | Tragic $40,669 |
| Immigrants | Cambodia | 2.6 /100 | #237 | Tragic $40,434 |
| Somalis | 2.4 /100 | #238 | Tragic $40,367 |
| Tsimshian | 2.4 /100 | #239 | Tragic $40,344 |
| Immigrants | Nigeria | 2.3 /100 | #240 | Tragic $40,339 |
| British West Indians | 2.3 /100 | #241 | Tragic $40,330 |
| Immigrants | Western Africa | 2.2 /100 | #242 | Tragic $40,294 |
| German Russians | 2.2 /100 | #243 | Tragic $40,266 |
| French American Indians | 2.1 /100 | #244 | Tragic $40,244 |
| Sub-Saharan Africans | 1.9 /100 | #245 | Tragic $40,152 |
| Cree | 1.7 /100 | #246 | Tragic $40,056 |
| Immigrants | Somalia | 1.6 /100 | #247 | Tragic $39,974 |