Colville vs Immigrants from Bangladesh Per Capita Income
COMPARE
Colville
Immigrants from Bangladesh
Per Capita Income
Per Capita Income Comparison
Colville
Immigrants from Bangladesh
$38,047
PER CAPITA INCOME
0.2/ 100
METRIC RATING
279th/ 347
METRIC RANK
$41,709
PER CAPITA INCOME
10.1/ 100
METRIC RATING
214th/ 347
METRIC RANK
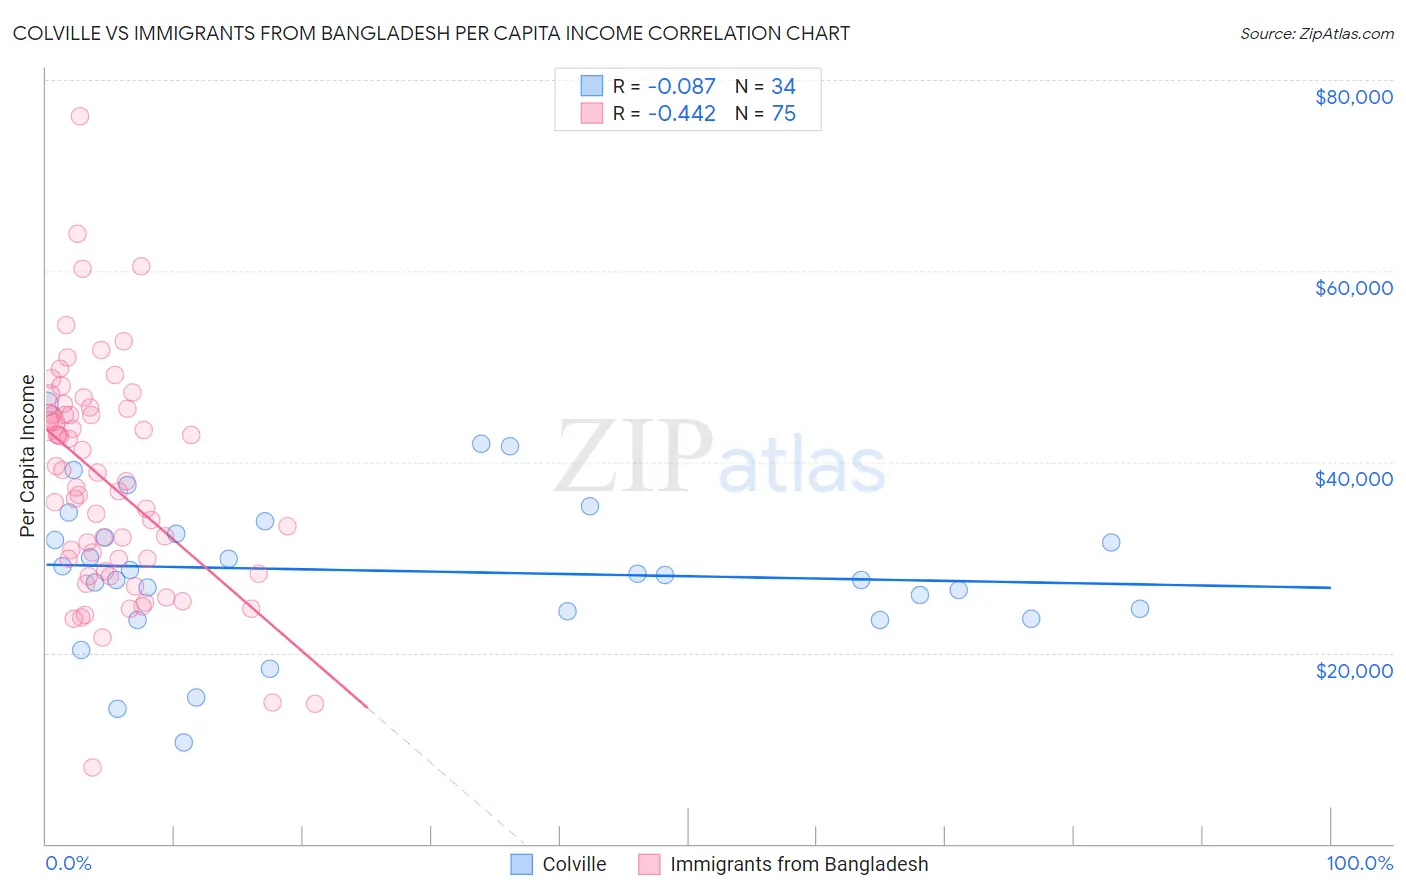
Colville vs Immigrants from Bangladesh Per Capita Income Correlation Chart
The statistical analysis conducted on geographies consisting of 34,687,707 people shows a slight negative correlation between the proportion of Colville and per capita income in the United States with a correlation coefficient (R) of -0.087 and weighted average of $38,047. Similarly, the statistical analysis conducted on geographies consisting of 203,679,462 people shows a moderate negative correlation between the proportion of Immigrants from Bangladesh and per capita income in the United States with a correlation coefficient (R) of -0.442 and weighted average of $41,709, a difference of 9.6%.
Per Capita Income Correlation Summary
| Measurement | Colville | Immigrants from Bangladesh |
| Minimum | $10,541 | $8,026 |
| Maximum | $46,065 | $76,210 |
| Range | $35,524 | $68,184 |
| Mean | $28,594 | $37,925 |
| Median | $28,215 | $37,941 |
| Interquartile 25% (IQ1) | $24,418 | $28,589 |
| Interquartile 75% (IQ3) | $32,462 | $44,956 |
| Interquartile Range (IQR) | $8,044 | $16,367 |
| Standard Deviation (Sample) | $7,817 | $11,865 |
| Standard Deviation (Population) | $7,701 | $11,786 |
Similar Demographics by Per Capita Income
Demographics Similar to Colville by Per Capita Income
In terms of per capita income, the demographic groups most similar to Colville are Potawatomi ($38,046, a difference of 0.0%), Immigrants from Nicaragua ($38,065, a difference of 0.050%), Comanche ($38,088, a difference of 0.11%), Hmong ($38,120, a difference of 0.19%), and Immigrants from Dominica ($37,952, a difference of 0.25%).
| Demographics | Rating | Rank | Per Capita Income |
| Immigrants | Cabo Verde | 0.3 /100 | #272 | Tragic $38,540 |
| Nepalese | 0.3 /100 | #273 | Tragic $38,442 |
| Immigrants | El Salvador | 0.3 /100 | #274 | Tragic $38,394 |
| Immigrants | Liberia | 0.2 /100 | #275 | Tragic $38,165 |
| Hmong | 0.2 /100 | #276 | Tragic $38,120 |
| Comanche | 0.2 /100 | #277 | Tragic $38,088 |
| Immigrants | Nicaragua | 0.2 /100 | #278 | Tragic $38,065 |
| Colville | 0.2 /100 | #279 | Tragic $38,047 |
| Potawatomi | 0.2 /100 | #280 | Tragic $38,046 |
| Immigrants | Dominica | 0.2 /100 | #281 | Tragic $37,952 |
| Immigrants | Laos | 0.1 /100 | #282 | Tragic $37,857 |
| Pennsylvania Germans | 0.1 /100 | #283 | Tragic $37,842 |
| Africans | 0.1 /100 | #284 | Tragic $37,785 |
| Guatemalans | 0.1 /100 | #285 | Tragic $37,766 |
| Central American Indians | 0.1 /100 | #286 | Tragic $37,699 |
Demographics Similar to Immigrants from Bangladesh by Per Capita Income
In terms of per capita income, the demographic groups most similar to Immigrants from Bangladesh are Sudanese ($41,695, a difference of 0.030%), Immigrants from Venezuela ($41,727, a difference of 0.040%), Tongan ($41,693, a difference of 0.040%), Guamanian/Chamorro ($41,678, a difference of 0.070%), and Trinidadian and Tobagonian ($41,655, a difference of 0.13%).
| Demographics | Rating | Rank | Per Capita Income |
| Venezuelans | 14.4 /100 | #207 | Poor $42,074 |
| Panamanians | 13.9 /100 | #208 | Poor $42,035 |
| Immigrants | Sudan | 13.2 /100 | #209 | Poor $41,986 |
| Ecuadorians | 12.9 /100 | #210 | Poor $41,958 |
| Immigrants | Panama | 11.6 /100 | #211 | Poor $41,853 |
| Immigrants | Senegal | 11.3 /100 | #212 | Poor $41,830 |
| Immigrants | Venezuela | 10.2 /100 | #213 | Poor $41,727 |
| Immigrants | Bangladesh | 10.1 /100 | #214 | Poor $41,709 |
| Sudanese | 9.9 /100 | #215 | Tragic $41,695 |
| Tongans | 9.9 /100 | #216 | Tragic $41,693 |
| Guamanians/Chamorros | 9.7 /100 | #217 | Tragic $41,678 |
| Trinidadians and Tobagonians | 9.5 /100 | #218 | Tragic $41,655 |
| Puget Sound Salish | 8.1 /100 | #219 | Tragic $41,495 |
| Immigrants | Barbados | 7.9 /100 | #220 | Tragic $41,478 |
| Immigrants | Trinidad and Tobago | 7.9 /100 | #221 | Tragic $41,476 |