Colville vs Sioux Disability Age 35 to 64
COMPARE
Colville
Sioux
Disability Age 35 to 64
Disability Age 35 to 64 Comparison
Colville
Sioux
15.8%
DISABILITY AGE 35 TO 64
0.0/ 100
METRIC RATING
334th/ 347
METRIC RANK
13.9%
DISABILITY AGE 35 TO 64
0.0/ 100
METRIC RATING
303rd/ 347
METRIC RANK
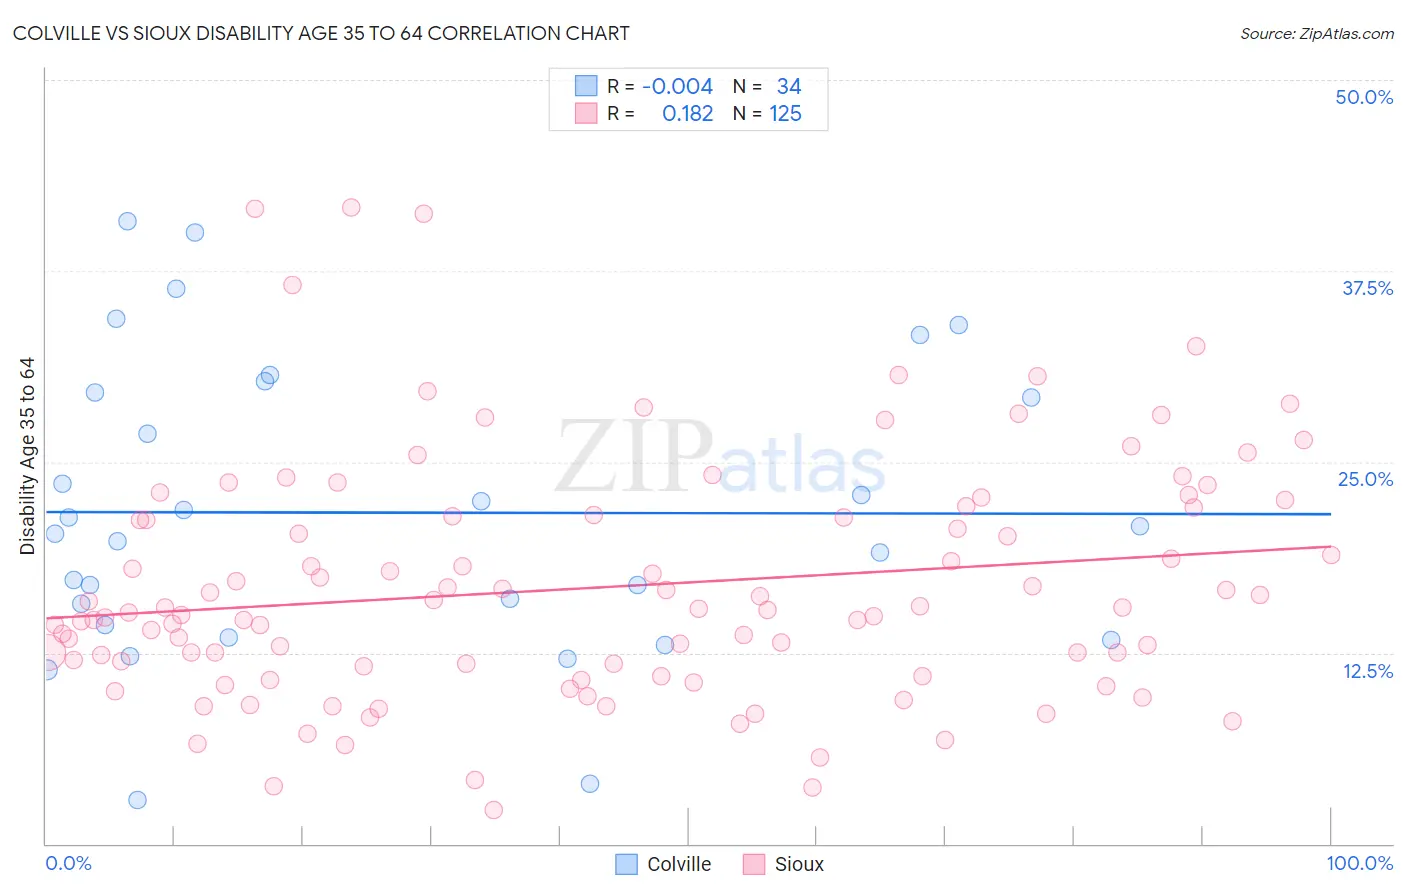
Colville vs Sioux Disability Age 35 to 64 Correlation Chart
The statistical analysis conducted on geographies consisting of 34,682,629 people shows no correlation between the proportion of Colville and percentage of population with a disability between the ages 34 and 64 in the United States with a correlation coefficient (R) of -0.004 and weighted average of 15.8%. Similarly, the statistical analysis conducted on geographies consisting of 234,072,168 people shows a poor positive correlation between the proportion of Sioux and percentage of population with a disability between the ages 34 and 64 in the United States with a correlation coefficient (R) of 0.182 and weighted average of 13.9%, a difference of 14.3%.
Disability Age 35 to 64 Correlation Summary
| Measurement | Colville | Sioux |
| Minimum | 2.9% | 2.2% |
| Maximum | 40.8% | 41.7% |
| Range | 37.9% | 39.5% |
| Mean | 21.7% | 16.8% |
| Median | 20.5% | 15.3% |
| Interquartile 25% (IQ1) | 14.4% | 11.3% |
| Interquartile 75% (IQ3) | 29.6% | 21.5% |
| Interquartile Range (IQR) | 15.2% | 10.2% |
| Standard Deviation (Sample) | 9.6% | 7.8% |
| Standard Deviation (Population) | 9.4% | 7.8% |
Similar Demographics by Disability Age 35 to 64
Demographics Similar to Colville by Disability Age 35 to 64
In terms of disability age 35 to 64, the demographic groups most similar to Colville are Seminole (15.9%, a difference of 0.10%), Yuman (15.8%, a difference of 0.19%), Menominee (15.9%, a difference of 0.33%), Puerto Rican (15.9%, a difference of 0.66%), and Alaskan Athabascan (15.7%, a difference of 0.75%).
| Demographics | Rating | Rank | Disability Age 35 to 64 |
| Pueblo | 0.0 /100 | #327 | Tragic 15.3% |
| Cajuns | 0.0 /100 | #328 | Tragic 15.3% |
| Cherokee | 0.0 /100 | #329 | Tragic 15.5% |
| Navajo | 0.0 /100 | #330 | Tragic 15.5% |
| Dutch West Indians | 0.0 /100 | #331 | Tragic 15.6% |
| Alaskan Athabascans | 0.0 /100 | #332 | Tragic 15.7% |
| Yuman | 0.0 /100 | #333 | Tragic 15.8% |
| Colville | 0.0 /100 | #334 | Tragic 15.8% |
| Seminole | 0.0 /100 | #335 | Tragic 15.9% |
| Menominee | 0.0 /100 | #336 | Tragic 15.9% |
| Puerto Ricans | 0.0 /100 | #337 | Tragic 15.9% |
| Chickasaw | 0.0 /100 | #338 | Tragic 16.1% |
| Pima | 0.0 /100 | #339 | Tragic 16.1% |
| Choctaw | 0.0 /100 | #340 | Tragic 16.4% |
| Tsimshian | 0.0 /100 | #341 | Tragic 16.7% |
Demographics Similar to Sioux by Disability Age 35 to 64
In terms of disability age 35 to 64, the demographic groups most similar to Sioux are Hopi (13.9%, a difference of 0.030%), Aleut (13.8%, a difference of 0.18%), American (13.9%, a difference of 0.41%), French American Indian (13.7%, a difference of 1.1%), and Immigrants from Yemen (14.0%, a difference of 1.3%).
| Demographics | Rating | Rank | Disability Age 35 to 64 |
| Africans | 0.0 /100 | #296 | Tragic 13.6% |
| Bangladeshis | 0.0 /100 | #297 | Tragic 13.6% |
| Cheyenne | 0.0 /100 | #298 | Tragic 13.6% |
| Spanish Americans | 0.0 /100 | #299 | Tragic 13.7% |
| Delaware | 0.0 /100 | #300 | Tragic 13.7% |
| French American Indians | 0.0 /100 | #301 | Tragic 13.7% |
| Aleuts | 0.0 /100 | #302 | Tragic 13.8% |
| Sioux | 0.0 /100 | #303 | Tragic 13.9% |
| Hopi | 0.0 /100 | #304 | Tragic 13.9% |
| Americans | 0.0 /100 | #305 | Tragic 13.9% |
| Immigrants | Yemen | 0.0 /100 | #306 | Tragic 14.0% |
| Blackfeet | 0.0 /100 | #307 | Tragic 14.1% |
| Inupiat | 0.0 /100 | #308 | Tragic 14.1% |
| Cree | 0.0 /100 | #309 | Tragic 14.1% |
| Cape Verdeans | 0.0 /100 | #310 | Tragic 14.1% |