Colville vs Northern European Per Capita Income
COMPARE
Colville
Northern European
Per Capita Income
Per Capita Income Comparison
Colville
Northern Europeans
$38,047
PER CAPITA INCOME
0.2/ 100
METRIC RATING
279th/ 347
METRIC RANK
$47,698
PER CAPITA INCOME
98.9/ 100
METRIC RATING
89th/ 347
METRIC RANK
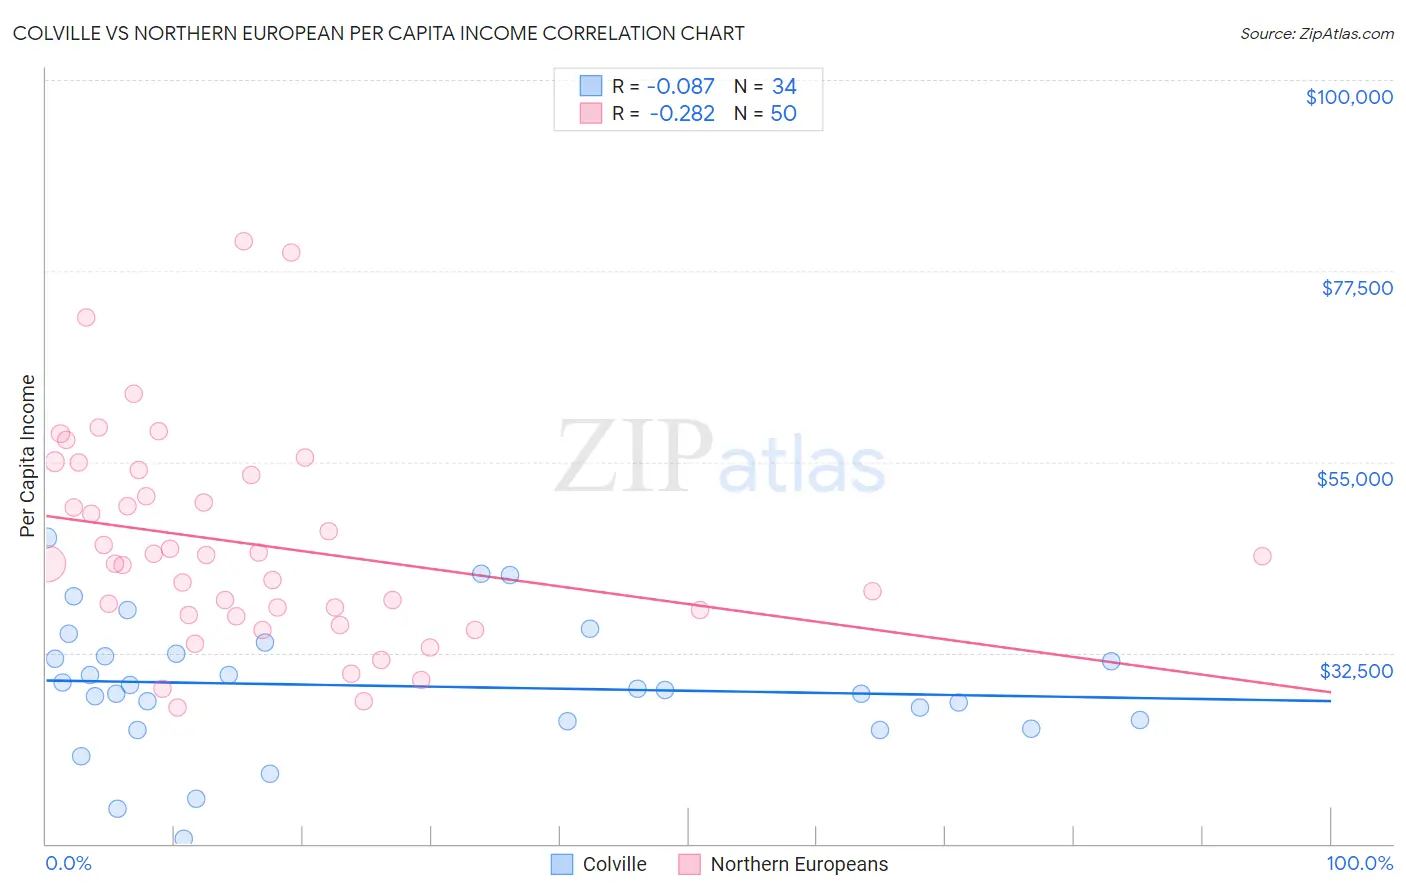
Colville vs Northern European Per Capita Income Correlation Chart
The statistical analysis conducted on geographies consisting of 34,687,707 people shows a slight negative correlation between the proportion of Colville and per capita income in the United States with a correlation coefficient (R) of -0.087 and weighted average of $38,047. Similarly, the statistical analysis conducted on geographies consisting of 406,105,495 people shows a weak negative correlation between the proportion of Northern Europeans and per capita income in the United States with a correlation coefficient (R) of -0.282 and weighted average of $47,698, a difference of 25.4%.
Per Capita Income Correlation Summary
| Measurement | Colville | Northern European |
| Minimum | $10,541 | $26,062 |
| Maximum | $46,065 | $80,940 |
| Range | $35,524 | $54,878 |
| Mean | $28,594 | $45,254 |
| Median | $28,215 | $43,430 |
| Interquartile 25% (IQ1) | $24,418 | $36,923 |
| Interquartile 75% (IQ3) | $32,462 | $53,441 |
| Interquartile Range (IQR) | $8,044 | $16,518 |
| Standard Deviation (Sample) | $7,817 | $12,375 |
| Standard Deviation (Population) | $7,701 | $12,250 |
Similar Demographics by Per Capita Income
Demographics Similar to Colville by Per Capita Income
In terms of per capita income, the demographic groups most similar to Colville are Potawatomi ($38,046, a difference of 0.0%), Immigrants from Nicaragua ($38,065, a difference of 0.050%), Comanche ($38,088, a difference of 0.11%), Hmong ($38,120, a difference of 0.19%), and Immigrants from Dominica ($37,952, a difference of 0.25%).
| Demographics | Rating | Rank | Per Capita Income |
| Immigrants | Cabo Verde | 0.3 /100 | #272 | Tragic $38,540 |
| Nepalese | 0.3 /100 | #273 | Tragic $38,442 |
| Immigrants | El Salvador | 0.3 /100 | #274 | Tragic $38,394 |
| Immigrants | Liberia | 0.2 /100 | #275 | Tragic $38,165 |
| Hmong | 0.2 /100 | #276 | Tragic $38,120 |
| Comanche | 0.2 /100 | #277 | Tragic $38,088 |
| Immigrants | Nicaragua | 0.2 /100 | #278 | Tragic $38,065 |
| Colville | 0.2 /100 | #279 | Tragic $38,047 |
| Potawatomi | 0.2 /100 | #280 | Tragic $38,046 |
| Immigrants | Dominica | 0.2 /100 | #281 | Tragic $37,952 |
| Immigrants | Laos | 0.1 /100 | #282 | Tragic $37,857 |
| Pennsylvania Germans | 0.1 /100 | #283 | Tragic $37,842 |
| Africans | 0.1 /100 | #284 | Tragic $37,785 |
| Guatemalans | 0.1 /100 | #285 | Tragic $37,766 |
| Central American Indians | 0.1 /100 | #286 | Tragic $37,699 |
Demographics Similar to Northern Europeans by Per Capita Income
In terms of per capita income, the demographic groups most similar to Northern Europeans are Croatian ($47,742, a difference of 0.090%), Italian ($47,574, a difference of 0.26%), Macedonian ($47,573, a difference of 0.26%), Immigrants from Moldova ($47,489, a difference of 0.44%), and Immigrants from Zimbabwe ($47,394, a difference of 0.64%).
| Demographics | Rating | Rank | Per Capita Income |
| Immigrants | Indonesia | 99.4 /100 | #82 | Exceptional $48,195 |
| Immigrants | Brazil | 99.4 /100 | #83 | Exceptional $48,164 |
| Immigrants | Ukraine | 99.3 /100 | #84 | Exceptional $48,134 |
| Austrians | 99.3 /100 | #85 | Exceptional $48,116 |
| Immigrants | Southern Europe | 99.3 /100 | #86 | Exceptional $48,027 |
| Ukrainians | 99.3 /100 | #87 | Exceptional $48,014 |
| Croatians | 99.0 /100 | #88 | Exceptional $47,742 |
| Northern Europeans | 98.9 /100 | #89 | Exceptional $47,698 |
| Italians | 98.8 /100 | #90 | Exceptional $47,574 |
| Macedonians | 98.8 /100 | #91 | Exceptional $47,573 |
| Immigrants | Moldova | 98.7 /100 | #92 | Exceptional $47,489 |
| Immigrants | Zimbabwe | 98.5 /100 | #93 | Exceptional $47,394 |
| Albanians | 98.5 /100 | #94 | Exceptional $47,379 |
| Immigrants | Egypt | 98.5 /100 | #95 | Exceptional $47,361 |
| Alsatians | 98.3 /100 | #96 | Exceptional $47,284 |