Colville vs Brazilian Per Capita Income
COMPARE
Colville
Brazilian
Per Capita Income
Per Capita Income Comparison
Colville
Brazilians
$38,047
PER CAPITA INCOME
0.2/ 100
METRIC RATING
279th/ 347
METRIC RANK
$46,700
PER CAPITA INCOME
96.8/ 100
METRIC RATING
104th/ 347
METRIC RANK
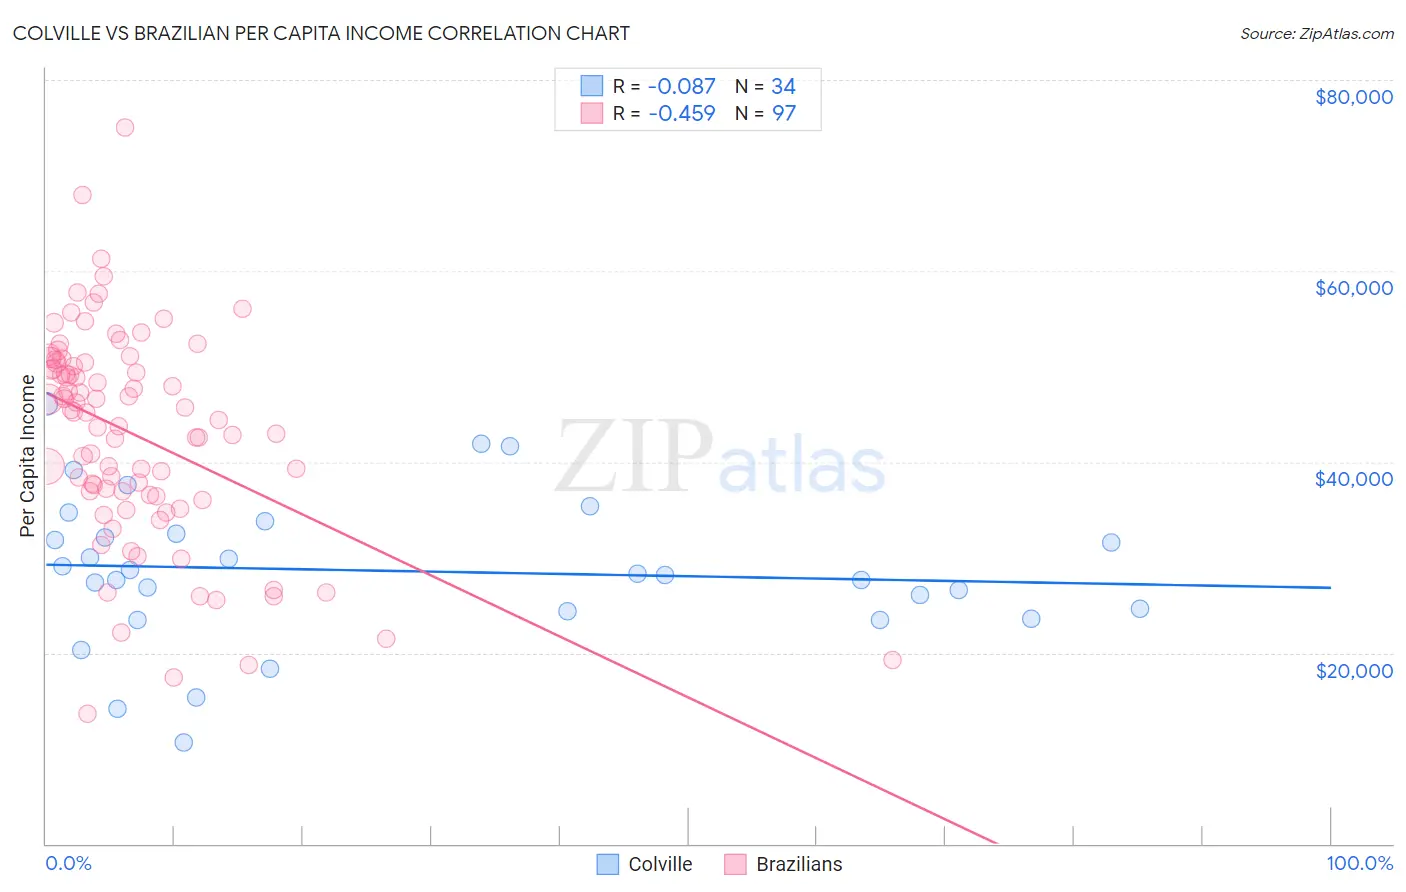
Colville vs Brazilian Per Capita Income Correlation Chart
The statistical analysis conducted on geographies consisting of 34,687,707 people shows a slight negative correlation between the proportion of Colville and per capita income in the United States with a correlation coefficient (R) of -0.087 and weighted average of $38,047. Similarly, the statistical analysis conducted on geographies consisting of 323,990,504 people shows a moderate negative correlation between the proportion of Brazilians and per capita income in the United States with a correlation coefficient (R) of -0.459 and weighted average of $46,700, a difference of 22.7%.
Per Capita Income Correlation Summary
| Measurement | Colville | Brazilian |
| Minimum | $10,541 | $13,624 |
| Maximum | $46,065 | $75,068 |
| Range | $35,524 | $61,444 |
| Mean | $28,594 | $42,865 |
| Median | $28,215 | $45,205 |
| Interquartile 25% (IQ1) | $24,418 | $36,434 |
| Interquartile 75% (IQ3) | $32,462 | $50,401 |
| Interquartile Range (IQR) | $8,044 | $13,966 |
| Standard Deviation (Sample) | $7,817 | $11,177 |
| Standard Deviation (Population) | $7,701 | $11,120 |
Similar Demographics by Per Capita Income
Demographics Similar to Colville by Per Capita Income
In terms of per capita income, the demographic groups most similar to Colville are Potawatomi ($38,046, a difference of 0.0%), Immigrants from Nicaragua ($38,065, a difference of 0.050%), Comanche ($38,088, a difference of 0.11%), Hmong ($38,120, a difference of 0.19%), and Immigrants from Dominica ($37,952, a difference of 0.25%).
| Demographics | Rating | Rank | Per Capita Income |
| Immigrants | Cabo Verde | 0.3 /100 | #272 | Tragic $38,540 |
| Nepalese | 0.3 /100 | #273 | Tragic $38,442 |
| Immigrants | El Salvador | 0.3 /100 | #274 | Tragic $38,394 |
| Immigrants | Liberia | 0.2 /100 | #275 | Tragic $38,165 |
| Hmong | 0.2 /100 | #276 | Tragic $38,120 |
| Comanche | 0.2 /100 | #277 | Tragic $38,088 |
| Immigrants | Nicaragua | 0.2 /100 | #278 | Tragic $38,065 |
| Colville | 0.2 /100 | #279 | Tragic $38,047 |
| Potawatomi | 0.2 /100 | #280 | Tragic $38,046 |
| Immigrants | Dominica | 0.2 /100 | #281 | Tragic $37,952 |
| Immigrants | Laos | 0.1 /100 | #282 | Tragic $37,857 |
| Pennsylvania Germans | 0.1 /100 | #283 | Tragic $37,842 |
| Africans | 0.1 /100 | #284 | Tragic $37,785 |
| Guatemalans | 0.1 /100 | #285 | Tragic $37,766 |
| Central American Indians | 0.1 /100 | #286 | Tragic $37,699 |
Demographics Similar to Brazilians by Per Capita Income
In terms of per capita income, the demographic groups most similar to Brazilians are British ($46,571, a difference of 0.28%), Ethiopian ($46,569, a difference of 0.28%), Syrian ($46,837, a difference of 0.29%), Serbian ($46,551, a difference of 0.32%), and Immigrants from Kuwait ($46,543, a difference of 0.34%).
| Demographics | Rating | Rank | Per Capita Income |
| Carpatho Rusyns | 98.2 /100 | #97 | Exceptional $47,248 |
| Immigrants | Pakistan | 97.9 /100 | #98 | Exceptional $47,084 |
| Laotians | 97.8 /100 | #99 | Exceptional $47,041 |
| Immigrants | Lebanon | 97.5 /100 | #100 | Exceptional $46,938 |
| Immigrants | Uzbekistan | 97.5 /100 | #101 | Exceptional $46,929 |
| Immigrants | Western Asia | 97.4 /100 | #102 | Exceptional $46,876 |
| Syrians | 97.2 /100 | #103 | Exceptional $46,837 |
| Brazilians | 96.8 /100 | #104 | Exceptional $46,700 |
| British | 96.3 /100 | #105 | Exceptional $46,571 |
| Ethiopians | 96.3 /100 | #106 | Exceptional $46,569 |
| Serbians | 96.2 /100 | #107 | Exceptional $46,551 |
| Immigrants | Kuwait | 96.2 /100 | #108 | Exceptional $46,543 |
| Immigrants | Northern Africa | 96.2 /100 | #109 | Exceptional $46,531 |
| Chileans | 95.9 /100 | #110 | Exceptional $46,459 |
| Taiwanese | 95.8 /100 | #111 | Exceptional $46,455 |