Nonimmigrants vs West Indian Median Household Income
COMPARE
Nonimmigrants
West Indian
Median Household Income
Median Household Income Comparison
Nonimmigrants
West Indians
$79,429
MEDIAN HOUSEHOLD INCOME
2.6/ 100
METRIC RATING
241st/ 347
METRIC RANK
$78,455
MEDIAN HOUSEHOLD INCOME
1.4/ 100
METRIC RATING
249th/ 347
METRIC RANK
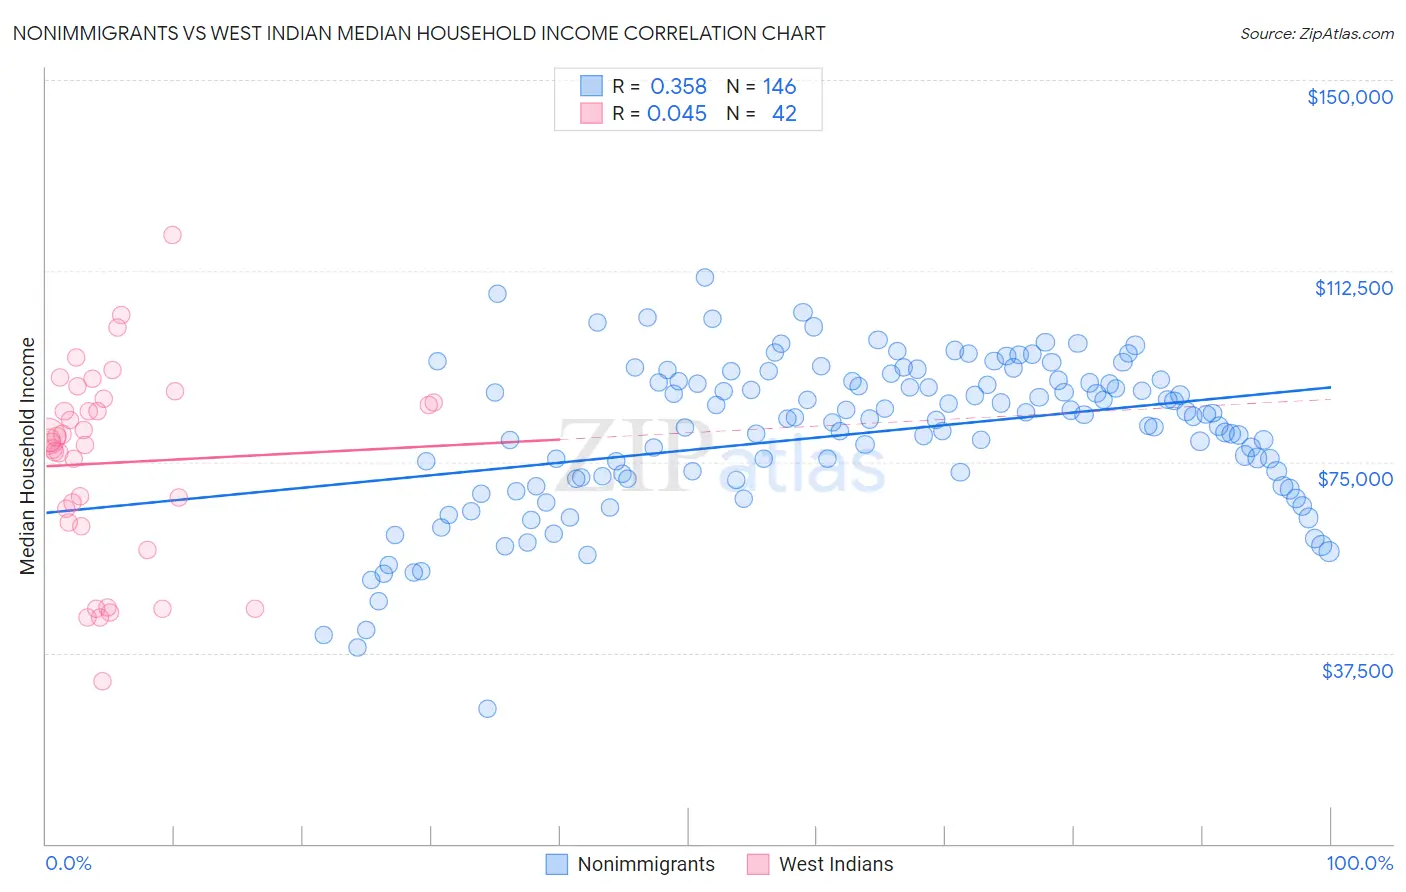
Nonimmigrants vs West Indian Median Household Income Correlation Chart
The statistical analysis conducted on geographies consisting of 582,891,477 people shows a mild positive correlation between the proportion of Nonimmigrants and median household income in the United States with a correlation coefficient (R) of 0.358 and weighted average of $79,429. Similarly, the statistical analysis conducted on geographies consisting of 253,821,014 people shows no correlation between the proportion of West Indians and median household income in the United States with a correlation coefficient (R) of 0.045 and weighted average of $78,455, a difference of 1.2%.
Median Household Income Correlation Summary
| Measurement | Nonimmigrants | West Indian |
| Minimum | $26,558 | $31,916 |
| Maximum | $111,218 | $119,474 |
| Range | $84,660 | $87,558 |
| Mean | $80,540 | $74,809 |
| Median | $83,608 | $79,024 |
| Interquartile 25% (IQ1) | $71,762 | $62,987 |
| Interquartile 75% (IQ3) | $90,776 | $86,556 |
| Interquartile Range (IQR) | $19,014 | $23,569 |
| Standard Deviation (Sample) | $15,013 | $19,069 |
| Standard Deviation (Population) | $14,961 | $18,840 |
Demographics Similar to Nonimmigrants and West Indians by Median Household Income
In terms of median household income, the demographic groups most similar to Nonimmigrants are Immigrants from Western Africa ($79,490, a difference of 0.080%), Alaska Native ($79,509, a difference of 0.10%), Barbadian ($79,664, a difference of 0.30%), Nicaraguan ($79,737, a difference of 0.39%), and Immigrants from Sudan ($79,103, a difference of 0.41%). Similarly, the demographic groups most similar to West Indians are Sudanese ($78,529, a difference of 0.090%), Immigrants from Laos ($78,327, a difference of 0.16%), Immigrants from Burma/Myanmar ($78,682, a difference of 0.29%), Mexican American Indian ($78,166, a difference of 0.37%), and Central American ($78,803, a difference of 0.44%).
| Demographics | Rating | Rank | Median Household Income |
| Immigrants | Guyana | 4.5 /100 | #235 | Tragic $80,324 |
| Immigrants | Bosnia and Herzegovina | 3.4 /100 | #236 | Tragic $79,888 |
| Nicaraguans | 3.1 /100 | #237 | Tragic $79,737 |
| Barbadians | 3.0 /100 | #238 | Tragic $79,664 |
| Alaska Natives | 2.7 /100 | #239 | Tragic $79,509 |
| Immigrants | Western Africa | 2.7 /100 | #240 | Tragic $79,490 |
| Immigrants | Nonimmigrants | 2.6 /100 | #241 | Tragic $79,429 |
| Immigrants | Sudan | 2.1 /100 | #242 | Tragic $79,103 |
| Immigrants | Barbados | 1.9 /100 | #243 | Tragic $78,989 |
| Marshallese | 1.9 /100 | #244 | Tragic $78,930 |
| Inupiat | 1.8 /100 | #245 | Tragic $78,841 |
| Central Americans | 1.7 /100 | #246 | Tragic $78,803 |
| Immigrants | Burma/Myanmar | 1.6 /100 | #247 | Tragic $78,682 |
| Sudanese | 1.5 /100 | #248 | Tragic $78,529 |
| West Indians | 1.4 /100 | #249 | Tragic $78,455 |
| Immigrants | Laos | 1.3 /100 | #250 | Tragic $78,327 |
| Mexican American Indians | 1.2 /100 | #251 | Tragic $78,166 |
| Immigrants | West Indies | 1.0 /100 | #252 | Tragic $77,956 |
| Immigrants | St. Vincent and the Grenadines | 0.9 /100 | #253 | Tragic $77,690 |
| Sub-Saharan Africans | 0.8 /100 | #254 | Tragic $77,631 |
| Immigrants | Middle Africa | 0.8 /100 | #255 | Tragic $77,559 |